Integrate Ezeelogin SSH Jump host with ELK for SIEM
Integrating Ezeelogin SSH gateway with ELK stack for SIEM
Overview: This article outlines the process of integrating Ezeelogin SSH gateway with the ELK stack for SIEM. It includes installing and configuring ElasticSearch and Kibana on a monitoring server and Logstash on the Ezeelogin Jump Host server. Detailed instructions are provided for sending MySQL table data from the Ezeelogin server to ElasticSearch using Logstash, as well as setting up Kibana for data visualization. The article also covers verifying and visualizing data in Kibana once it is indexed in ElasticSearch.
In the example below, we would be installing ElasticSearch and Kibana on the monitoring server [monitor.eznoc.com ( Centos 7 OS)] and the Logstash daemon on the Ezeelogin Jumphost server.
Step 1. Install Java 8
[root@monitor-eznoc ~]# yum install java-1.8.0-openjdk.x86_64
[root@monitor-eznoc ~]# java -version
openjdk version "1.8.0_272"
OpenJDK Runtime Environment (build 1.8.0_272-b10)
OpenJDK 64-Bit Server VM (build 25.272-b10, mixed mode)
Step 2. Download the ElasticSearch
[root@monitor-eznoc ~]# wget https://artifacts.elastic.co/downloads/elasticsearch/elasticsearch-7.9.2-x86_64.rpm
[root@monitor-eznoc ~]# rpm -ivh elasticsearch-7.9.2-x86_64.rpm
[root@monitor-eznoc ~]# systemctl enable elasticsearch.service
[root@monitor-eznoc ~]# service elasticsearch restart
Step 3. Edit the ElasticSearch Configuration file and set the following variables.
[root@monitor-eznoc ~]# vi /etc/elasticsearch/elasticsearch.yml
cluster.name: elk-test
node.name: node-elk
path.data: /var/lib/elasticsearch
path.logs: /var/log/elasticsearch
network.host: 0.0.0.0
discovery.type: single-node
[root@monitor-eznoc ~]# service elasticsearch restart
Step 4. Test the ElasticSearch Response
[root@monitor-eznoc ~]# curl -X GET 'http://localhost:9200'
{
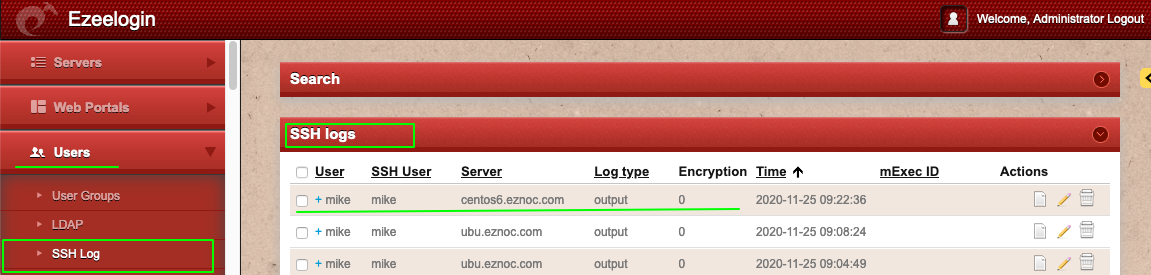
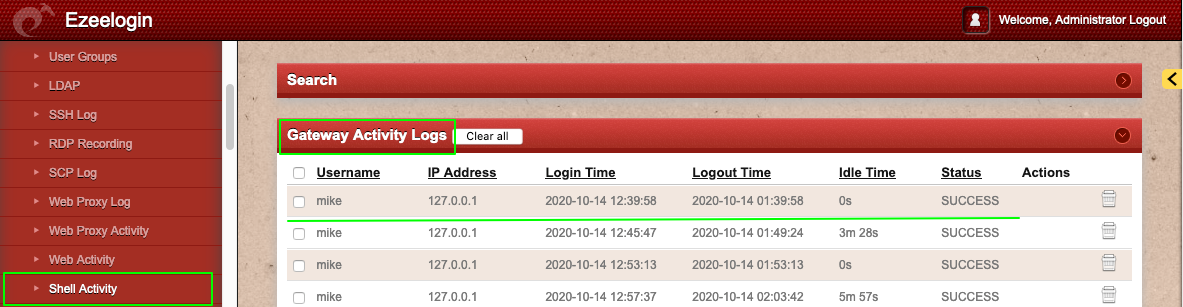
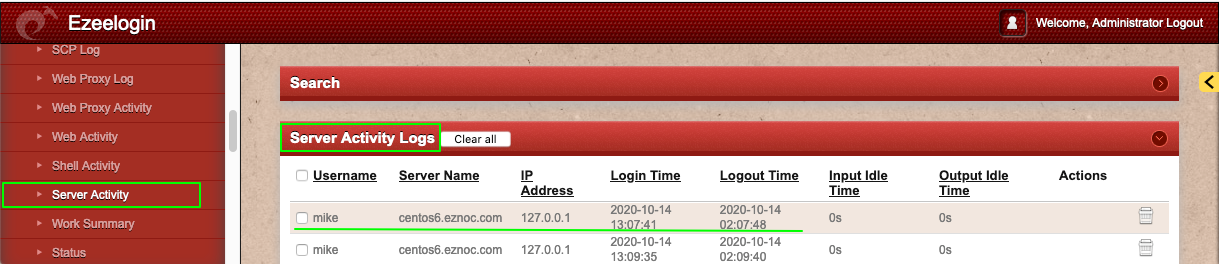
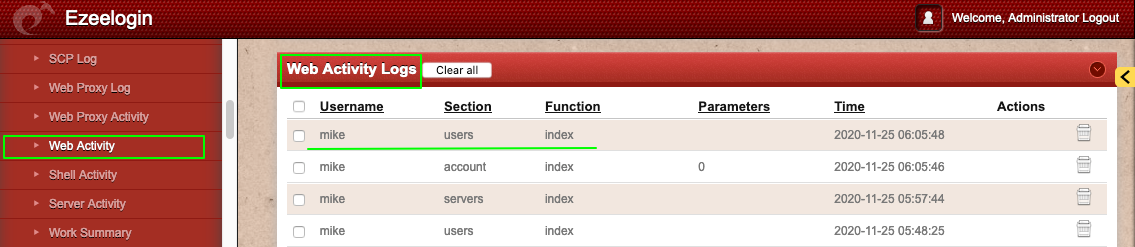
Step 5. Installing and Configuring Logstash on the Ezeelogin Jump Host server to send the Ezeelogin mysql table data ( fqn_sshlogs, fqn_gwactivity_logs, fqn_serveractivity_logs,fqn_webactivity_logs) to Elastic Search.
[root@jump-host ~]#rpm --import https://artifacts.elastic.co/GPG-KEY-elasticsearch
[root@jump-host ~] vi /etc/yum.repos.d/logstash.repo
[logstash-7.x]
name=Elastic repository for 7.x packages
baseurl=https://artifacts.elastic.co/packages/7.x/yum
gpgcheck=1
gpgkey=https://artifacts.elastic.co/GPG-KEY-elasticsearch
enabled=1
autorefresh=1
[root@jump-server ~] yum install logstash
Step 5.a. Sending the mysql tables fqn_sshlogs from Jump Host server to Remote ElasticSearch server using Logstash.
Step 5.d. Sending mysql table fqn_web_activity log from Jump Host server to Remote ElasticSearch server using Logstash.
Restart the logstash daemon
[root@jump-host ~] systemctl restart logstash
Step 6. Installing and Configuring the Kibana Dashboard on the monitoring server. Refer the article
[root@jump-host ~]# rpm --import https://artifacts.elastic.co/GPG-KEY-elasticsearch
[root@jump-host ~]#vi /etc/yum.repos.d/kibana.repo
[kibana-7.x]
[root@jump-host ~]# yum install kibana
[root@jump-host ~]# systemctl enable kibana.service;systemctl start kibana.service
Access the Kibana Dashboard http://monitor.eznoc.com/app/kibana#/management/kibana/index_patterns?_g=()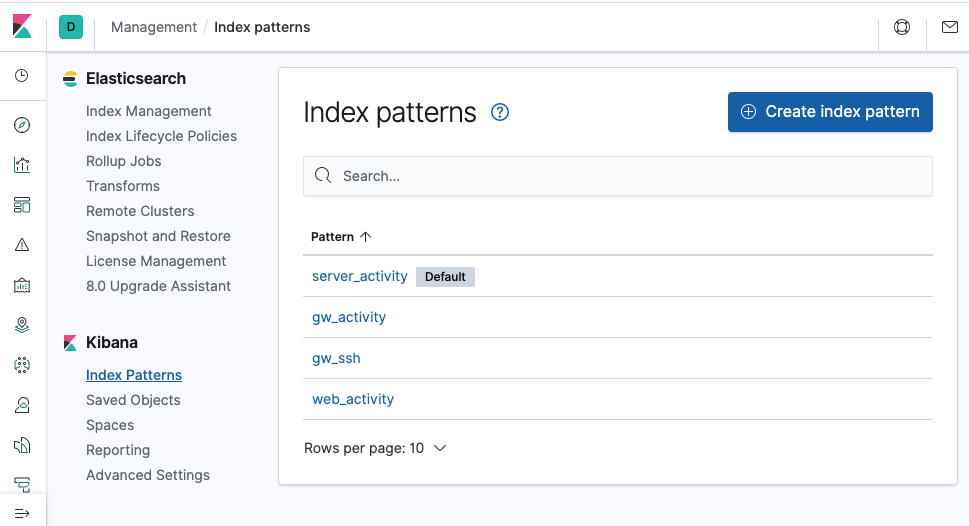
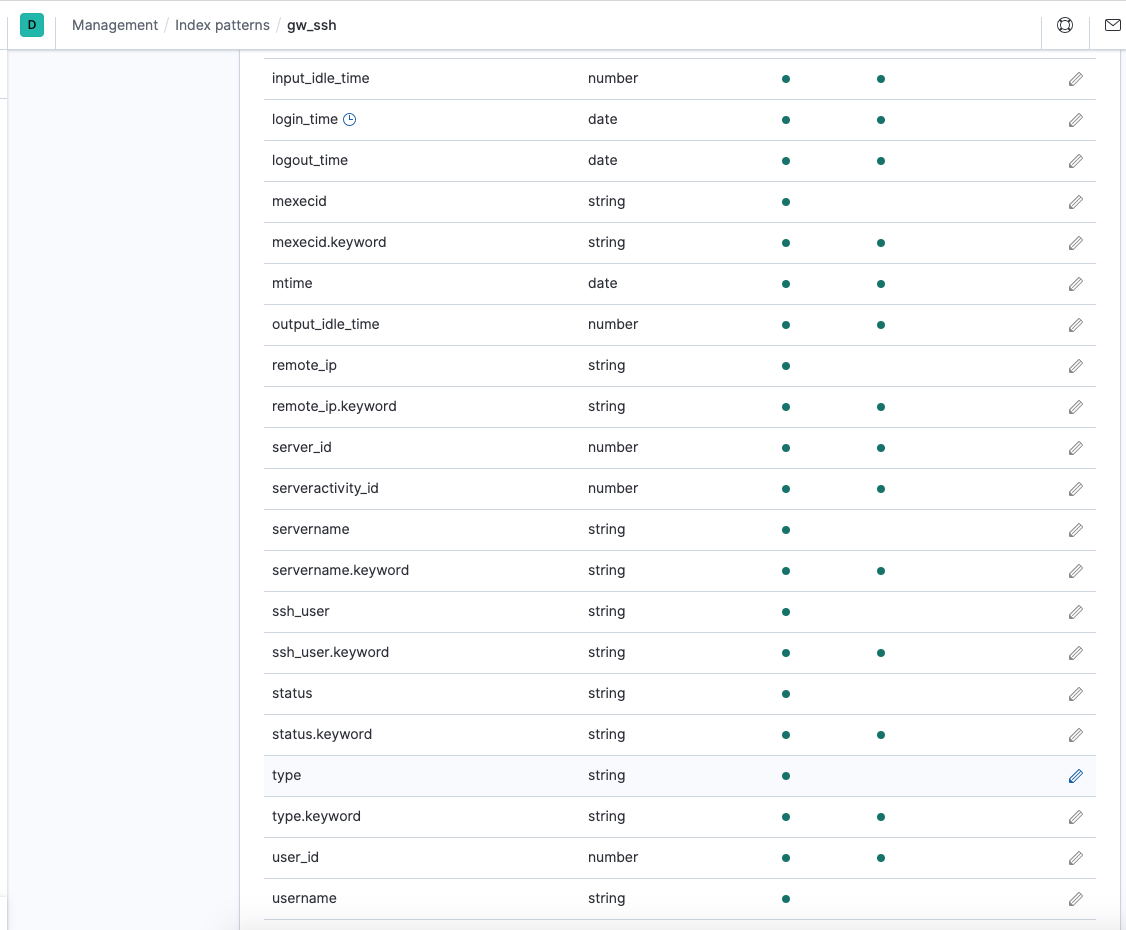
Click on the gw_ssh index pattern and you will be able to see the data from mysql table fqn_sshlogs belonging to Ezeelogin Jump Server database.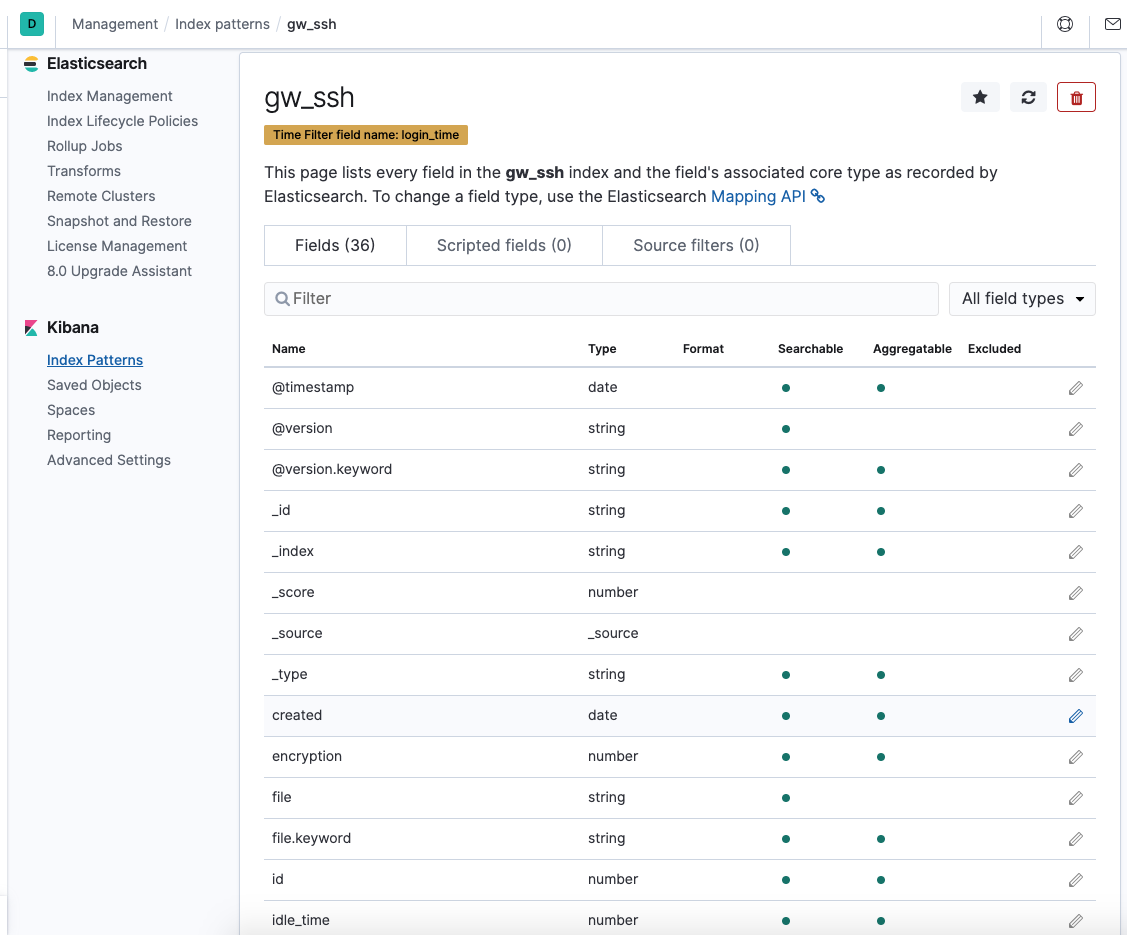
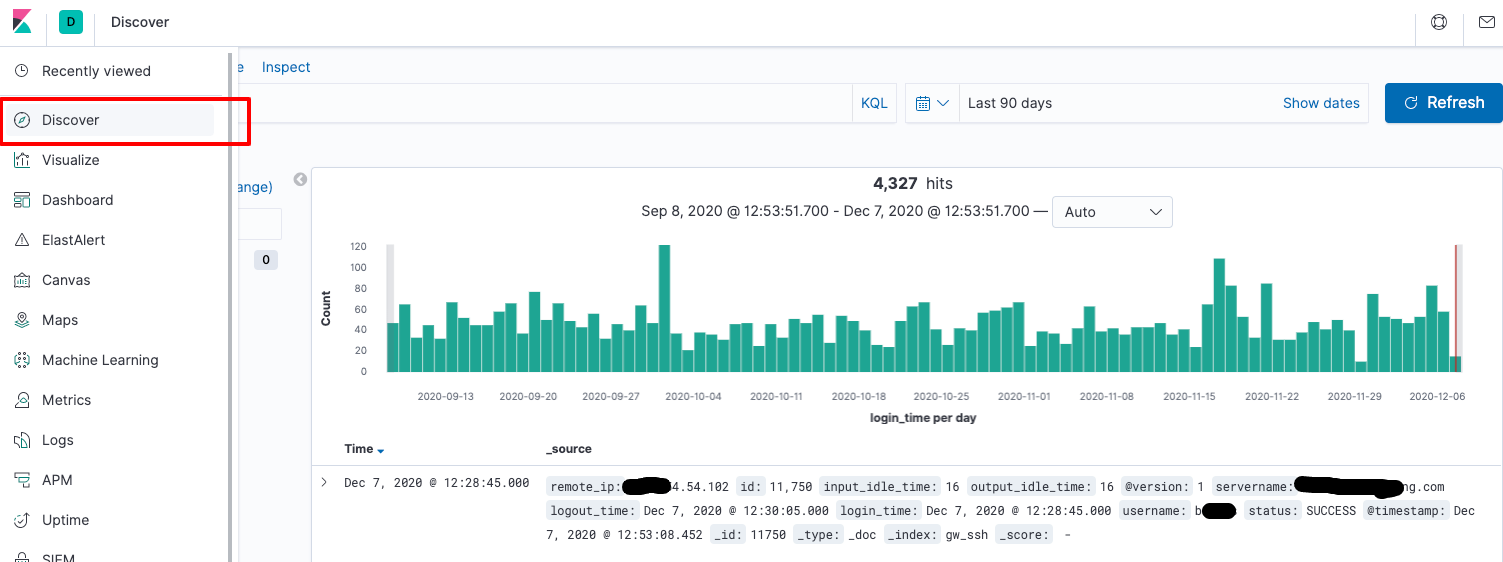
Once you have the data in ElasticSearch, you can verify the mysql data fetched under "Discovery".
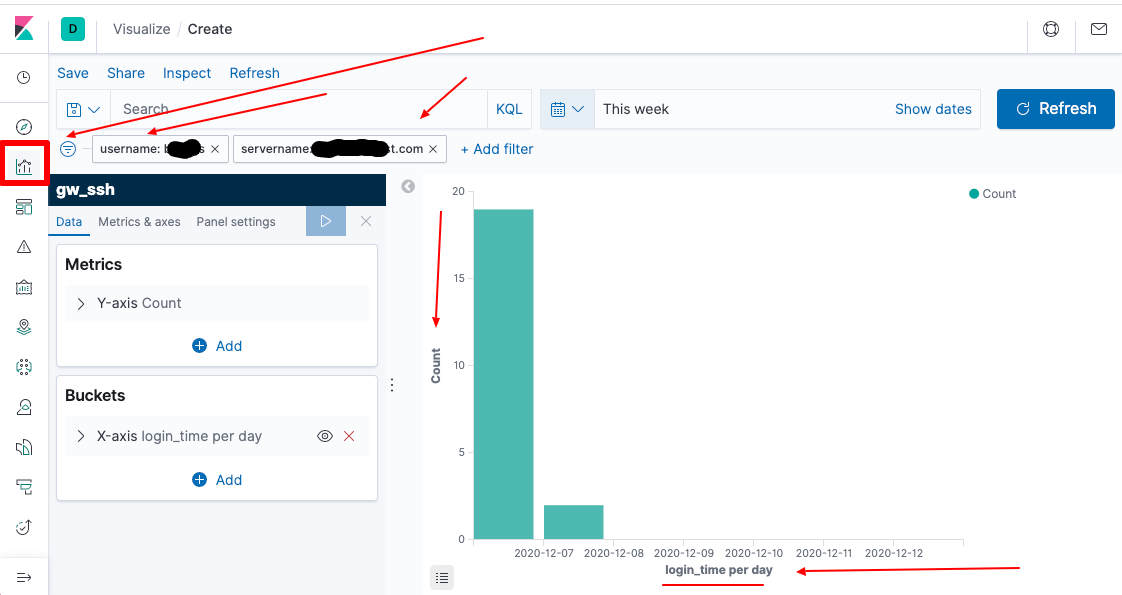
You can create different type of Visualizations from data imported using the "Visualize" feature.
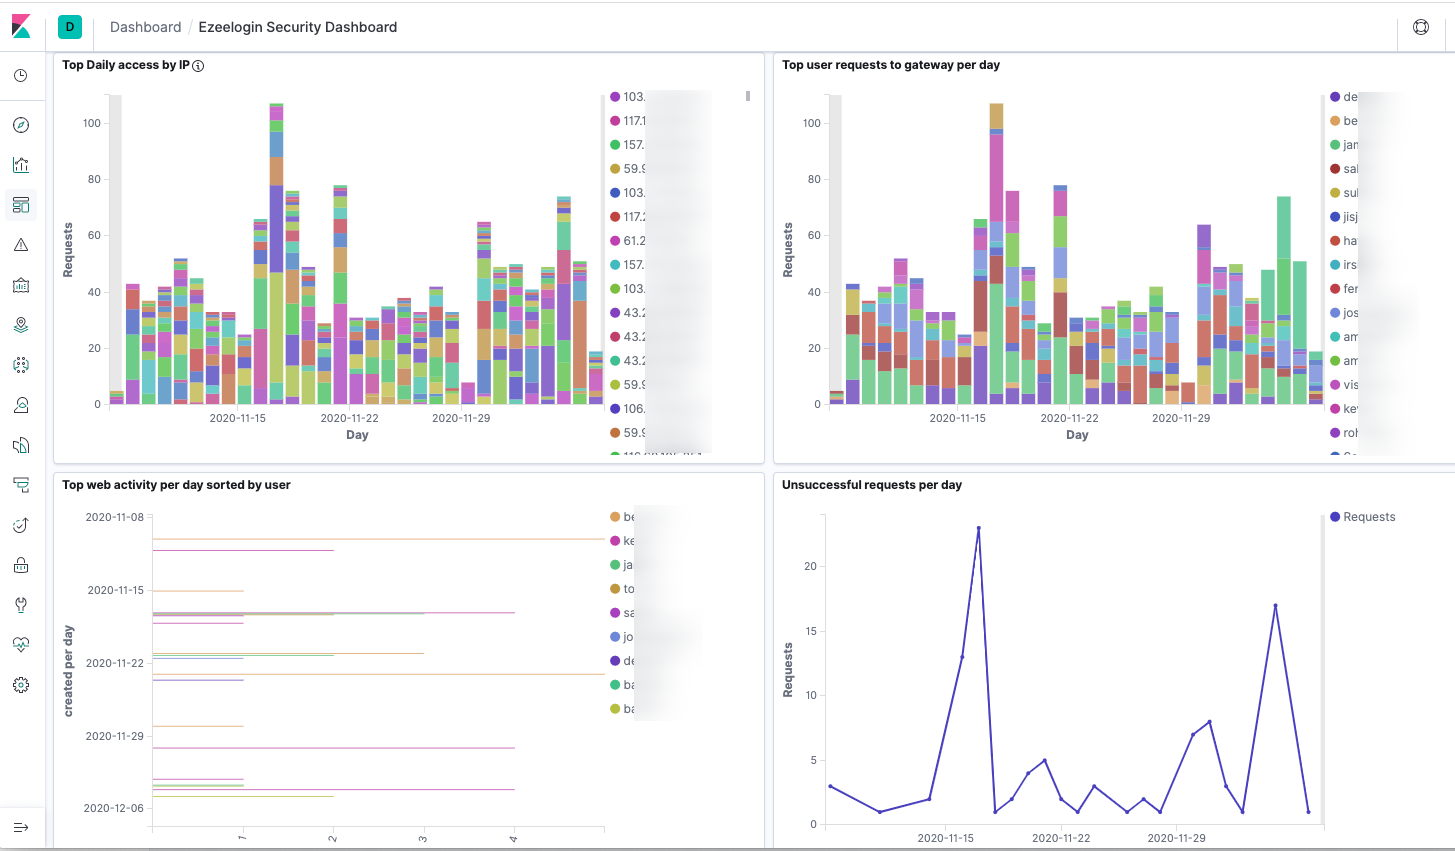
You can also create a dashboard for in Kibana to view the various graphical visualization that was created.
Related Articles
Integrate SSH Jump server with splunk for SIEM
Integrate SSH Jump Server with syslog