How to forward SSH Jump Server logs to Splunk?
Overview: This article explains how to configure Splunk HTTP Event Collector (HEC) to forward Ezeelogin SSH Jump Server logs for real-time monitoring and analysis.
Splunk is a software platform designed for searching, monitoring, and analyzing machine-generated data in real time. It provides insights into various data sources, including logs, events, and metrics, allowing organizations to gain information and troubleshoot efficiently. Splunk is widely used for log management, security information and event management (SIEM), and business analytics.
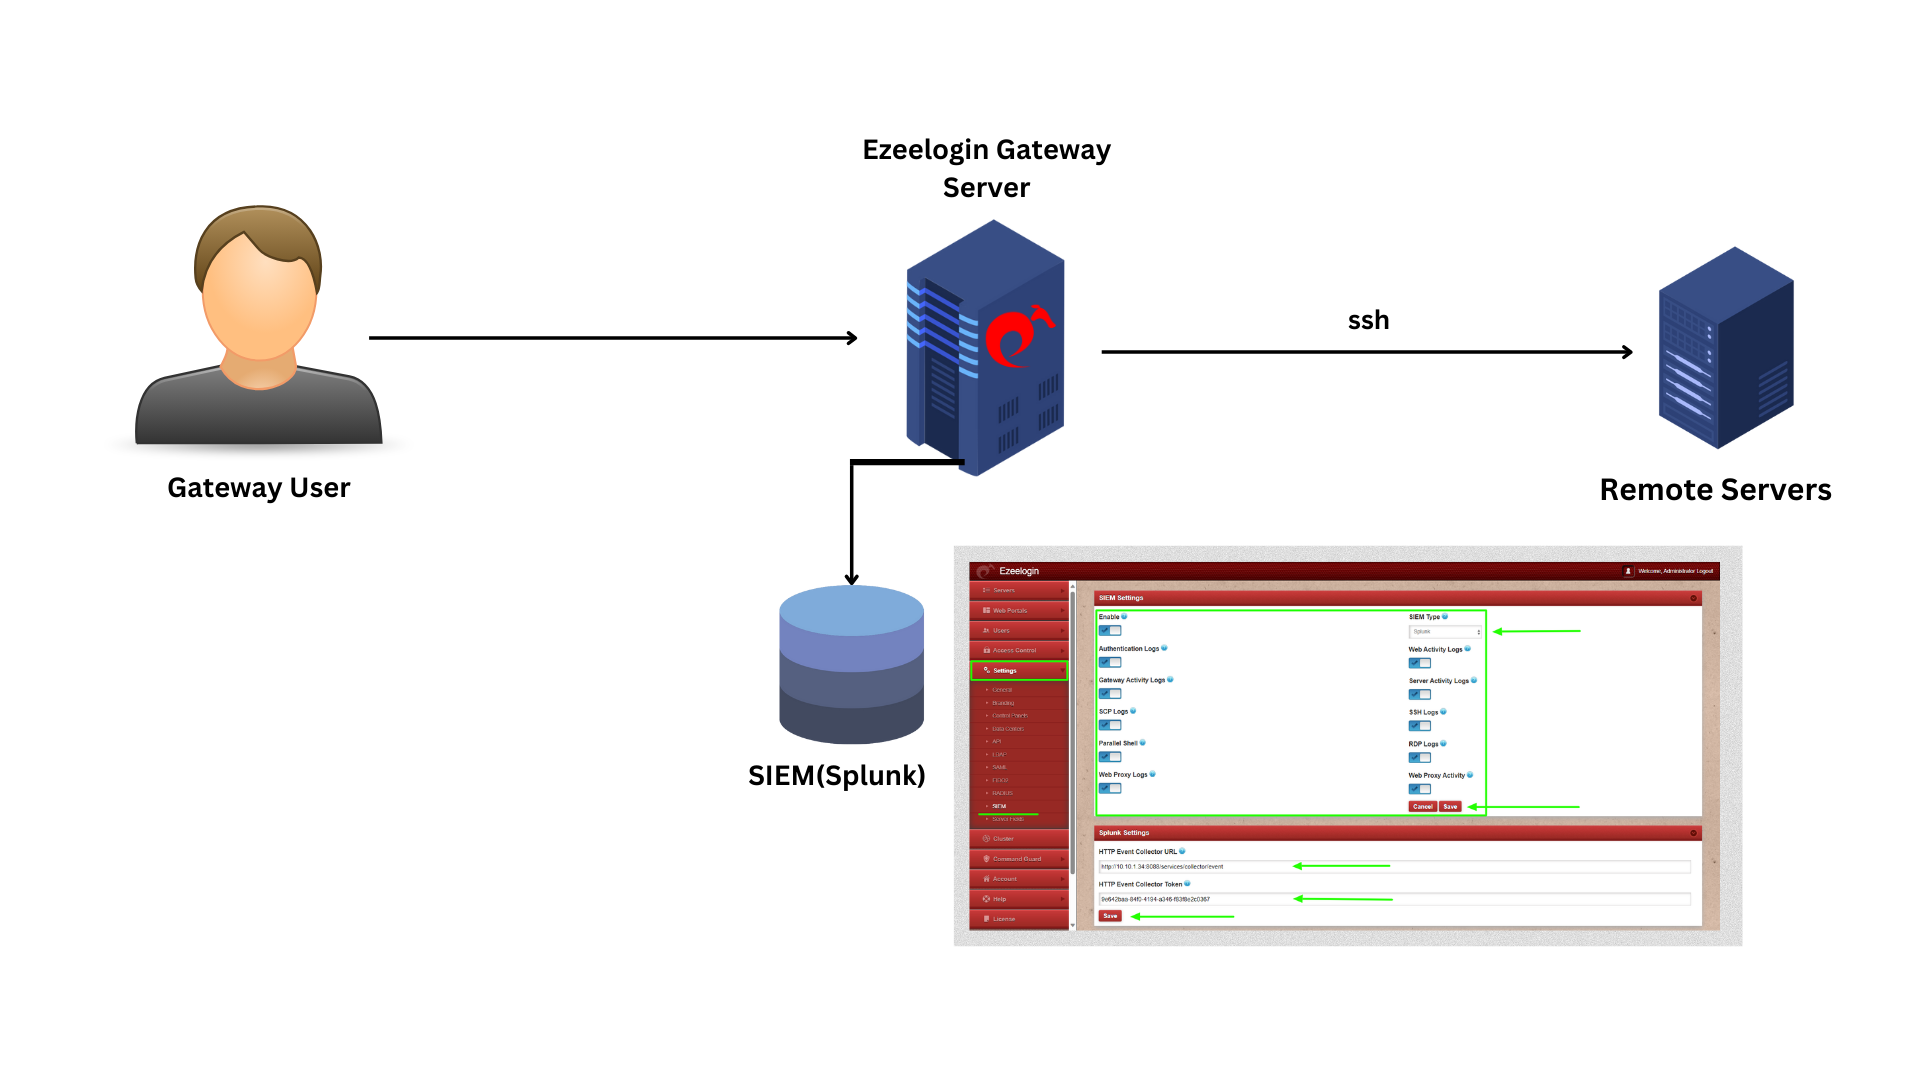 We are configuring Splunk HTTP Event Collector (HEC) which allows Ezelogin logs to be streamed to Splunk
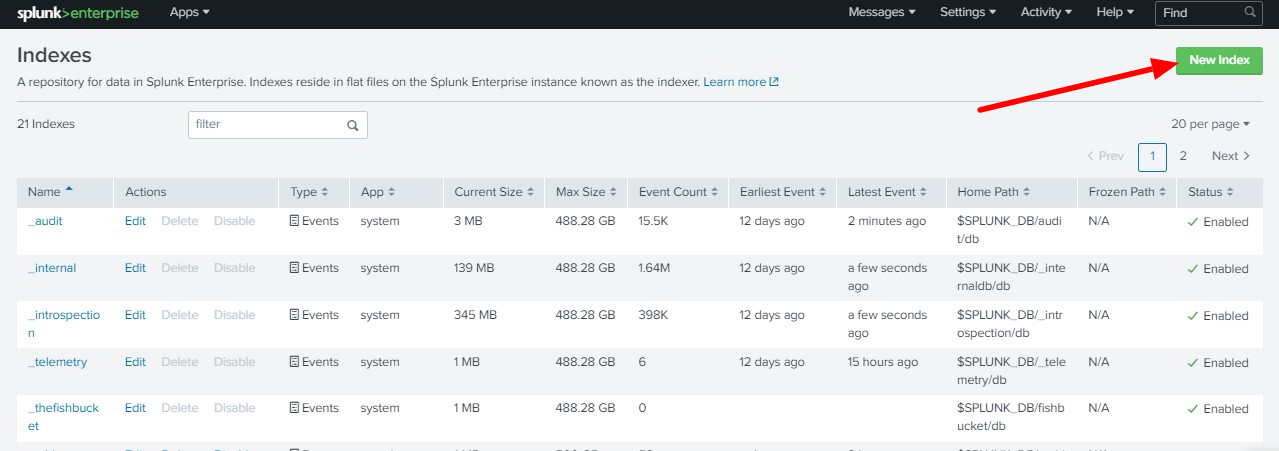
Step 1: Log in to Splunk and refer to the steps to create an index for Ezeelogin.
Click on Settings -> Indexes
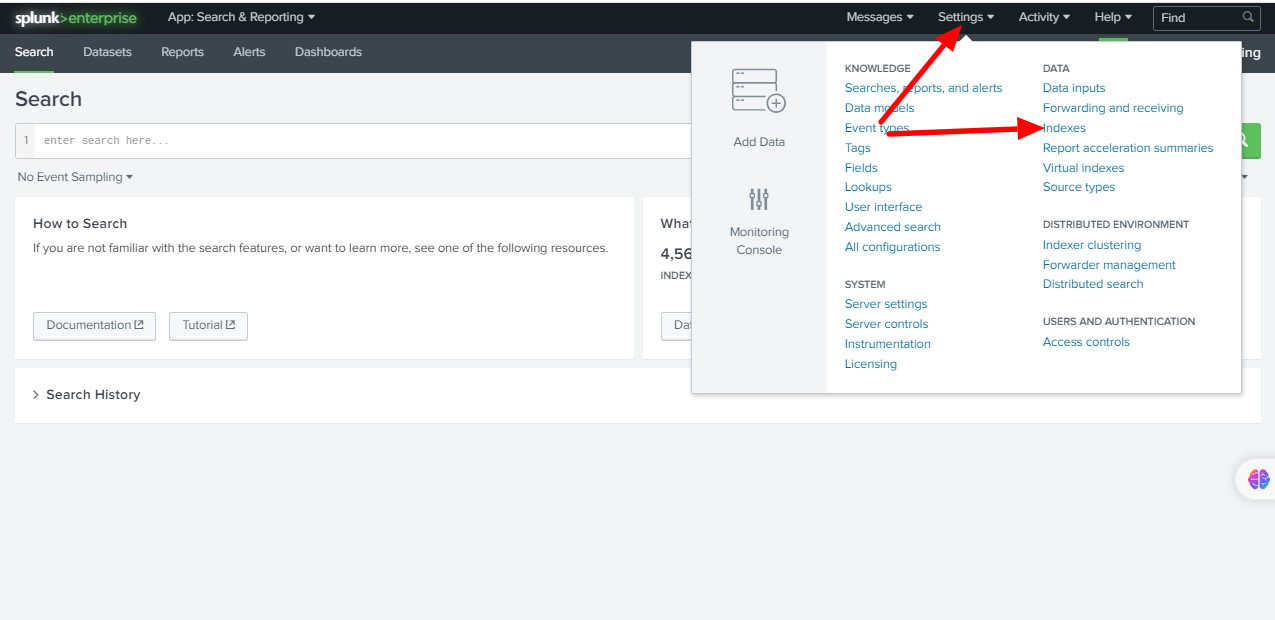
Step 2: Click on New Index to create a new index.
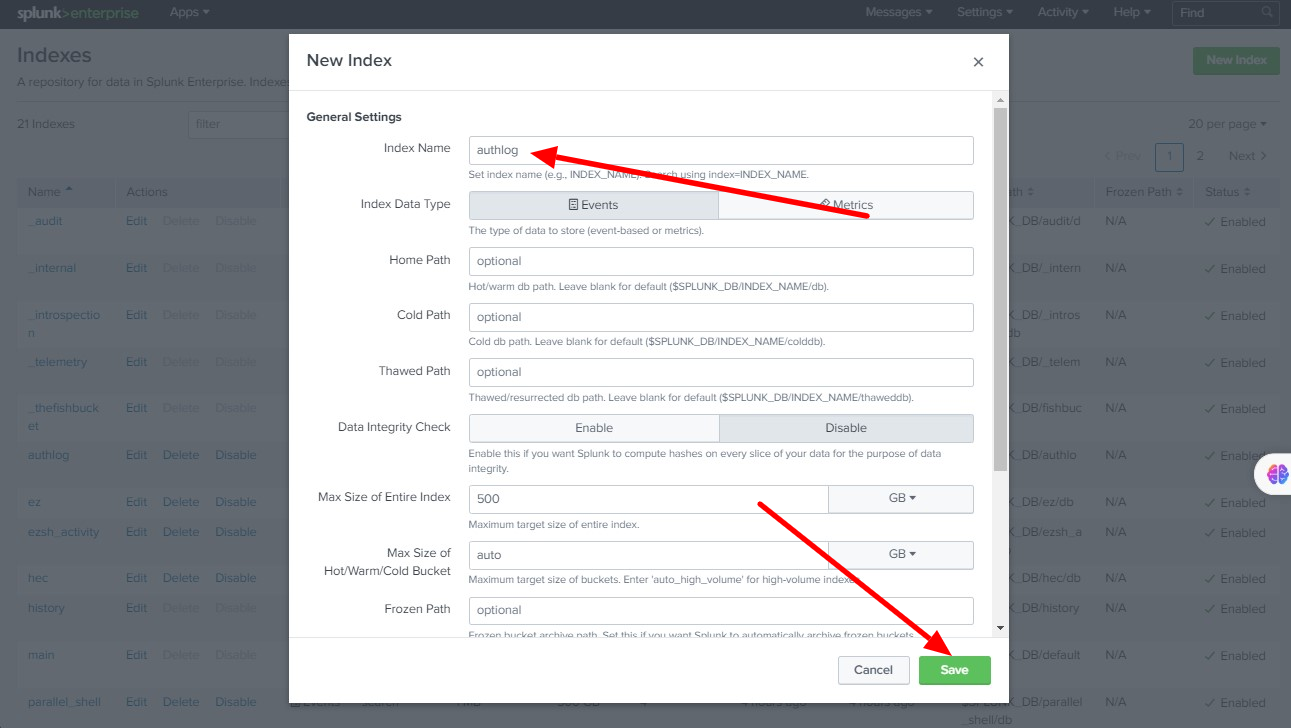
Step 3: Enter the Index Name and Save it. We need to add the following indexes for streaming Ezeelogin Logs
authlog
ezsh_activity
sshlogs
web_activity
server_activity
parallel_shell
rdplogs
web_proxy
web_proxy_activity
scplogs
Add all the above indexes one by one as follows.
Step 4: Create HTTP Event Collector and enable Global Settings
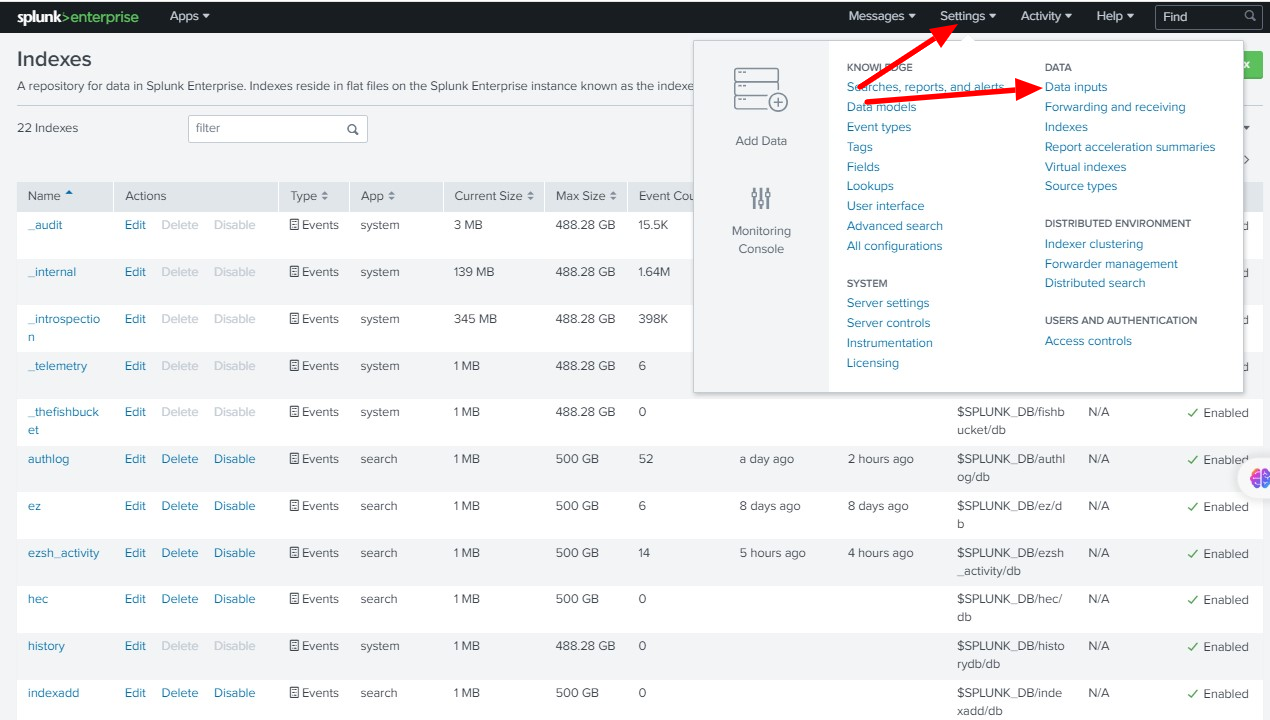
Step 4 A: Click on Settings -> Data inputs
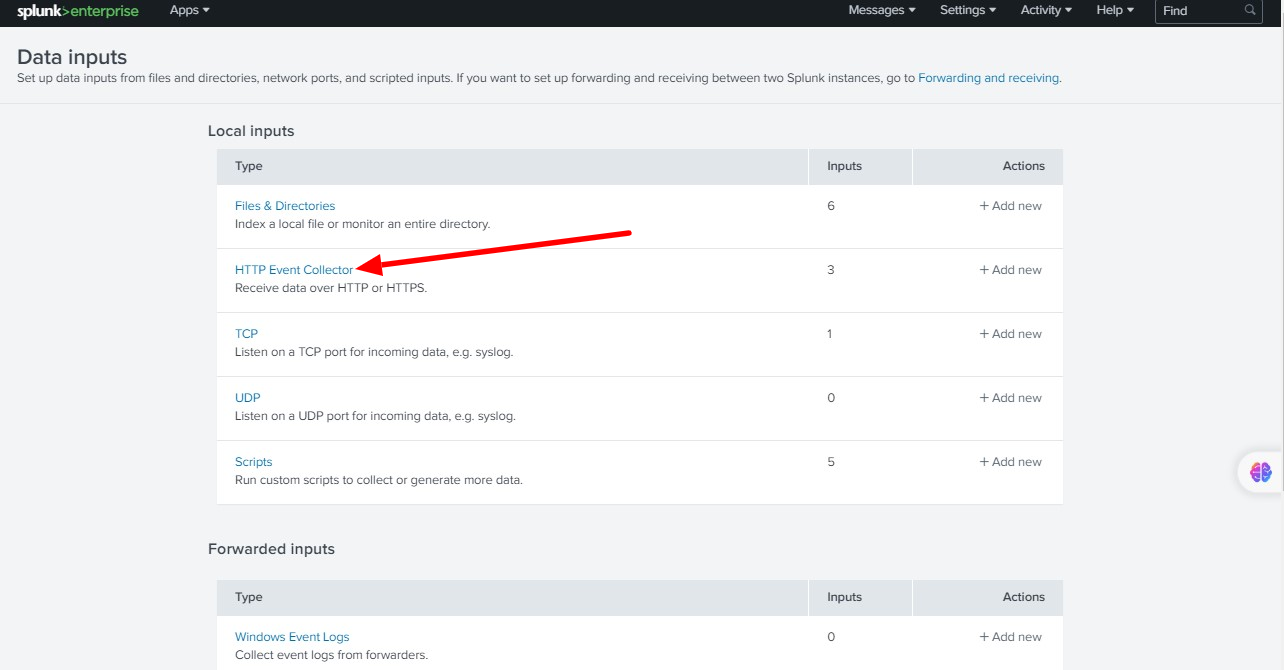
Step 4 B: Click on HTTP Event Collector
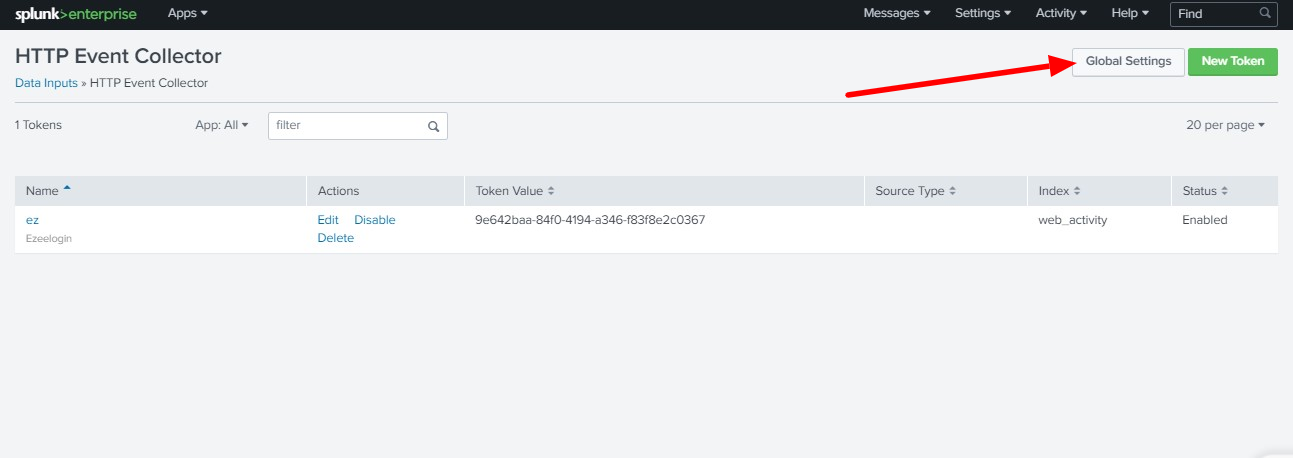
Step 4 C: Enable Global Settings
click on Global Settings
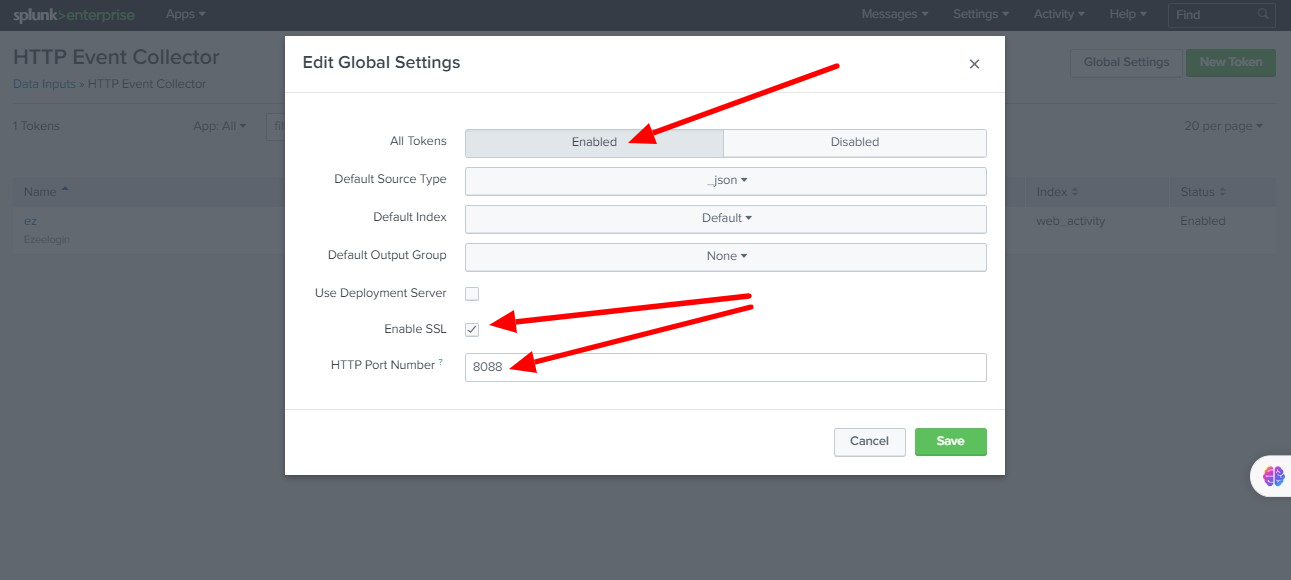
Step 4 D: Click Enabled -> Enable SSL (optional) ->Specify HTTP Port Number (8088) -> Save
Create HEC Token
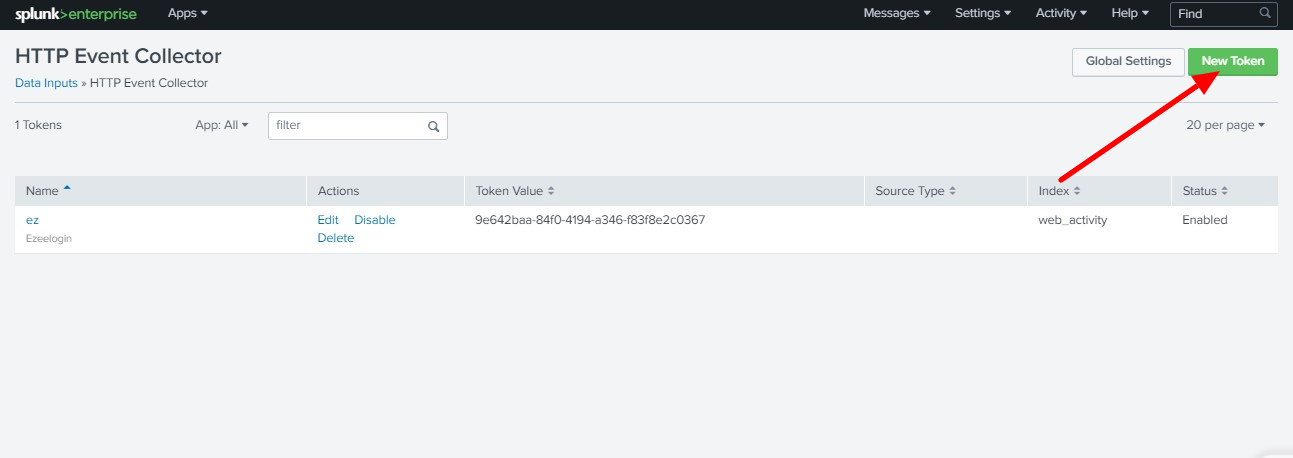
Step A: Click on New Token to create a security token.
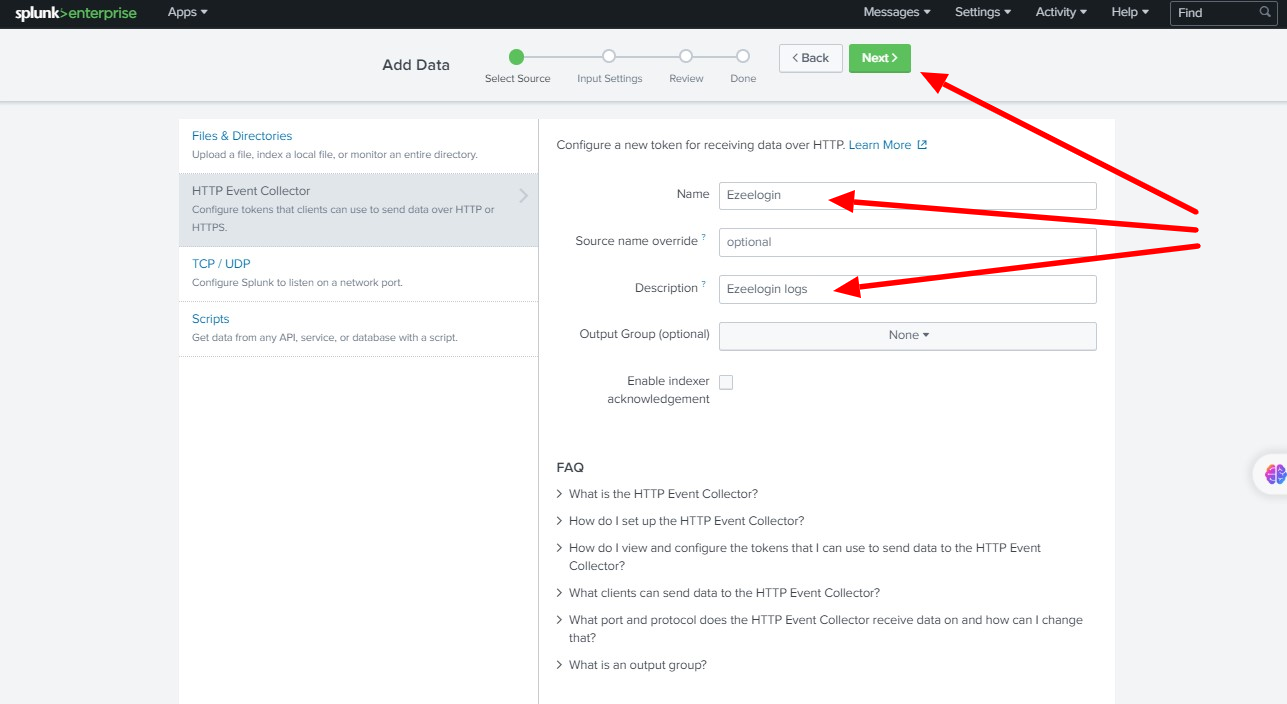
Step B: Enter Name ( Ezeelogin ) -> Description (optional) - > click Next
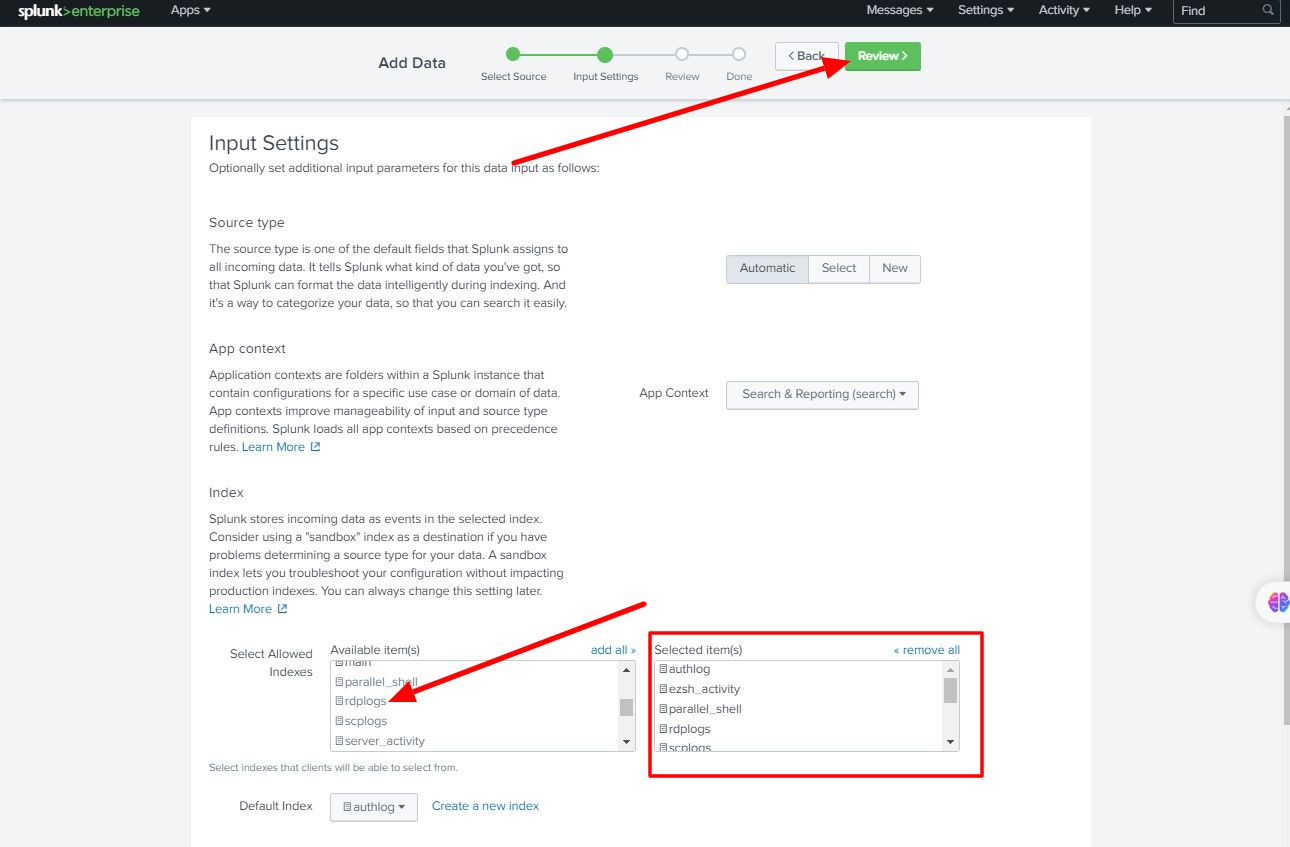
Step C: Select and Add the Indexes which created for Ezeelogin " authlog, ezsh_activity, sshlogs, web_activity, server_activity, parallel_shell, rdplogs, web_proxy, web_proxy_activity, scplogs " -> Click Review.
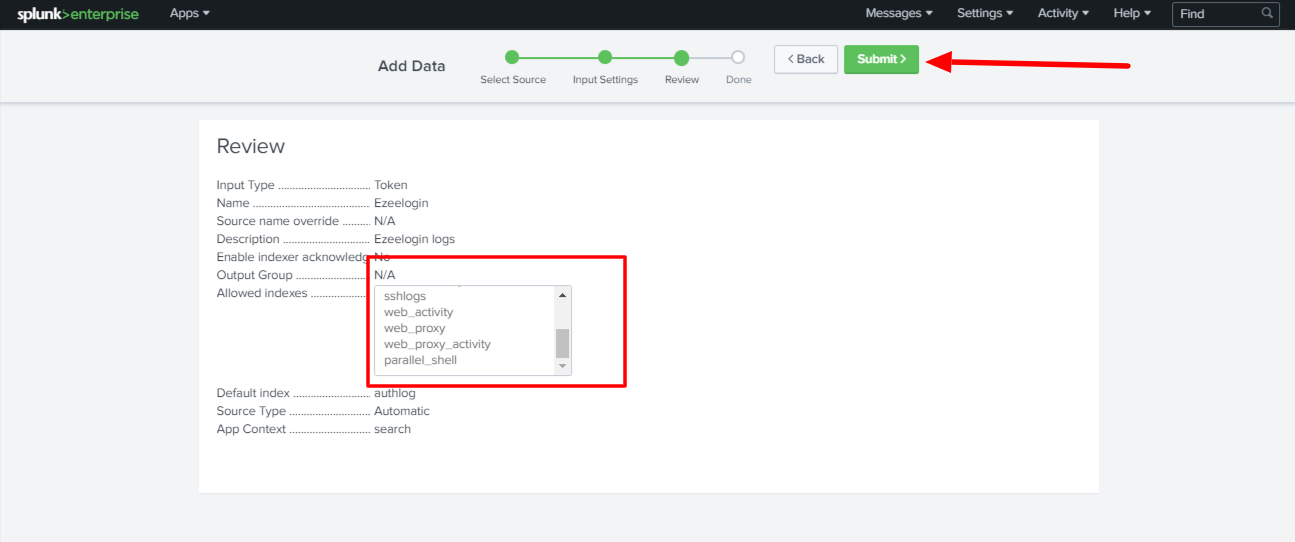
Step D: Review and make sure that you have selected all the indexes created for Ezeelogin and click Submit.
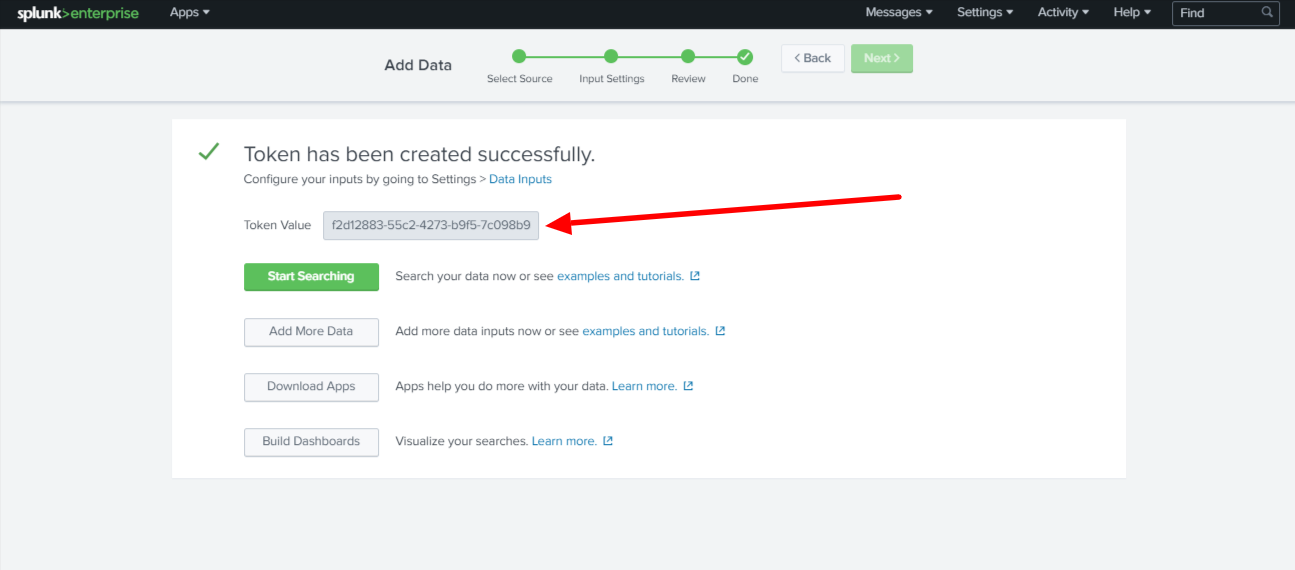
You can view a success message "Token has been created successfully." on the next window. You can find a Token and copy the Token Value from the window.
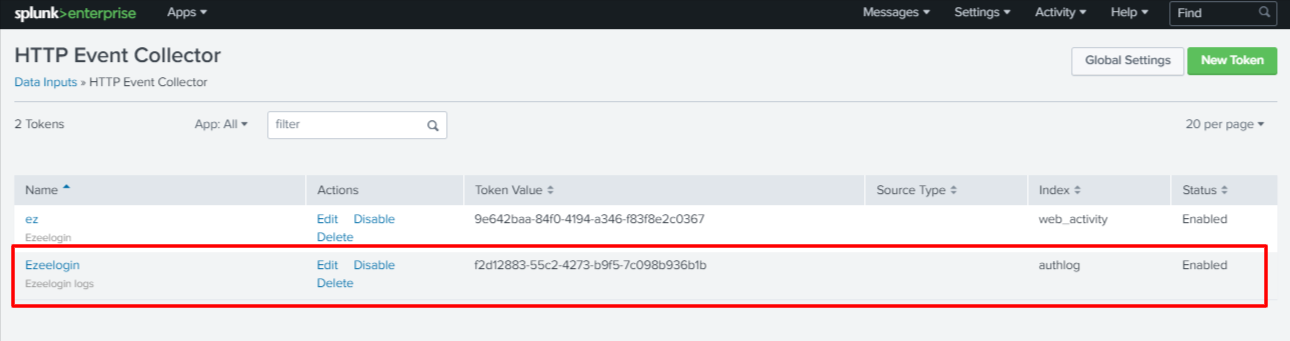
You can also view the tokens created from Settings > Data Inputs > HTTP Event Collector
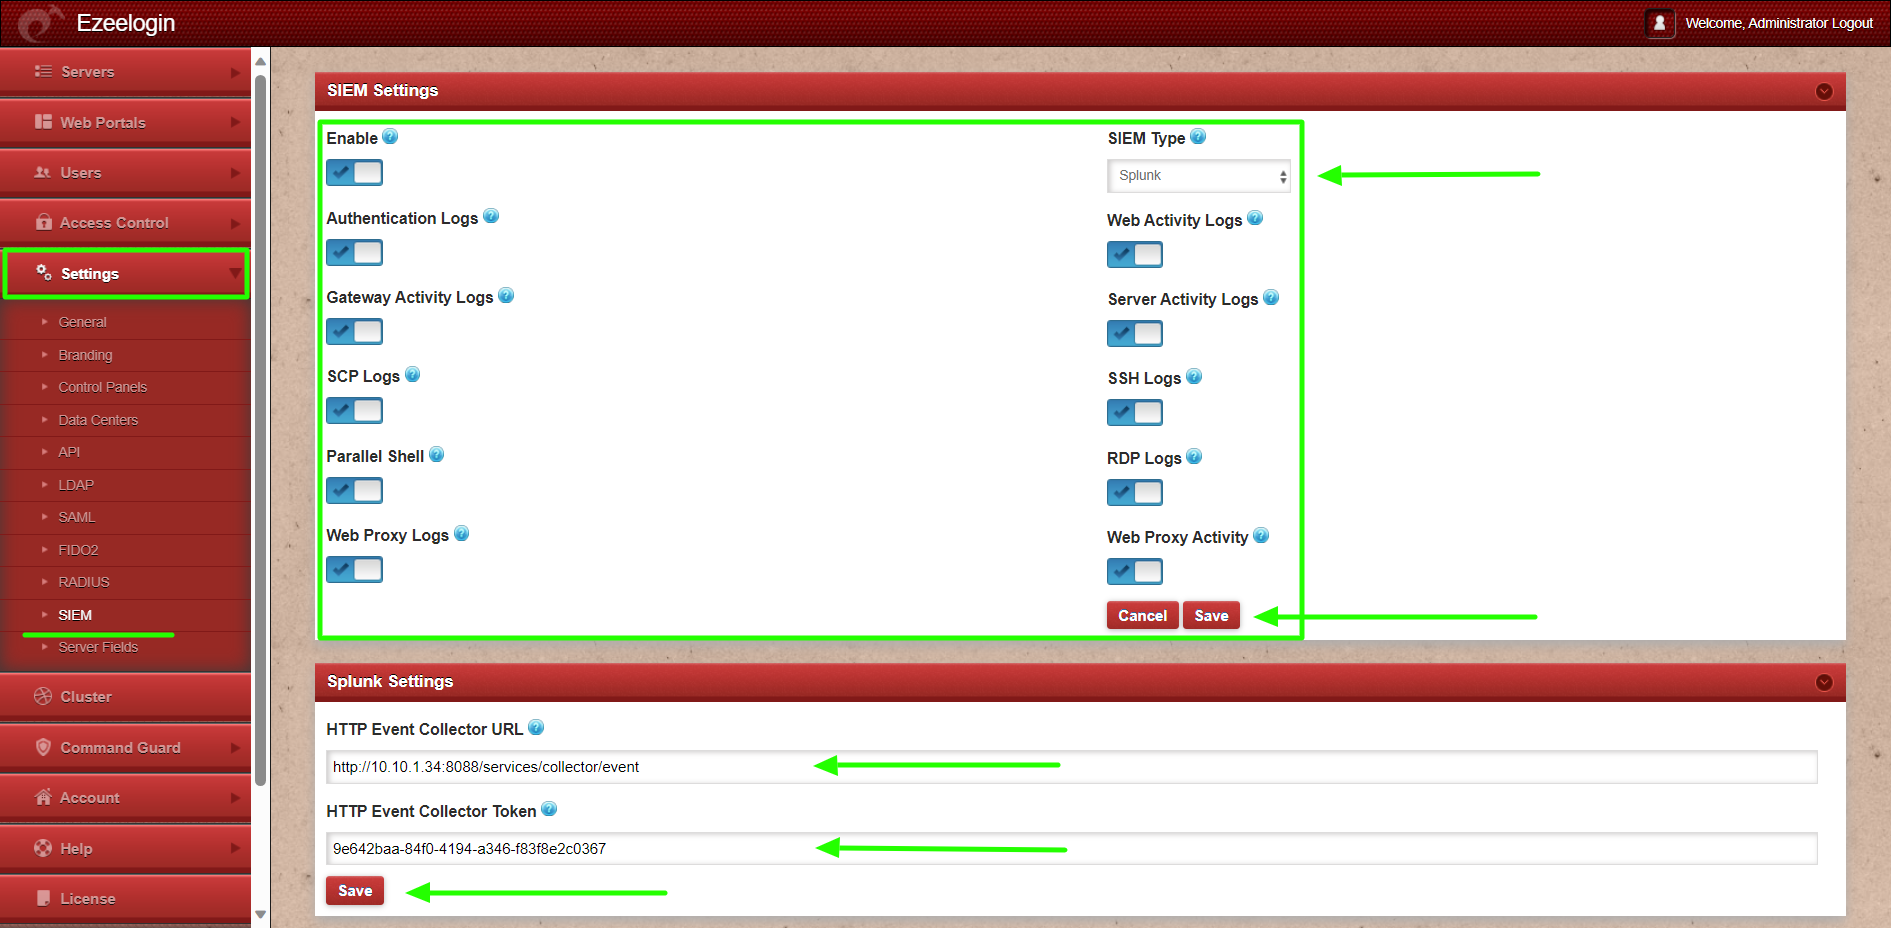
Step 5: Log in to Ezeelogin GUI to configure the Splunk settings in Ezeelogin.
Login to Ezeelogin GUI > Settings > SIEM > Enable SIEM, Web Activity Logs, Server Activity Logs, SSH Logs, RDP logs, Web Proxy Activity, Authentication Logs, Gateway Activity Logs, SCP Logs, Parallel Shell, Web Proxy Logs > Save.
Splunk Settings
Add HTTP Event Collector URL: https://mysplunkserver:8088/services/collector/event (Replace "mysplunkserver:8088" with the URL and Port of your Splunk server)
Add HTTP Event Collector Token: 9e642baa-84f0-4194-a346-f83f8e2c0367 (you can find the HTTP Event Collector Token from your Splunk server Settings > Data Inputs > HTTP Event Collector)
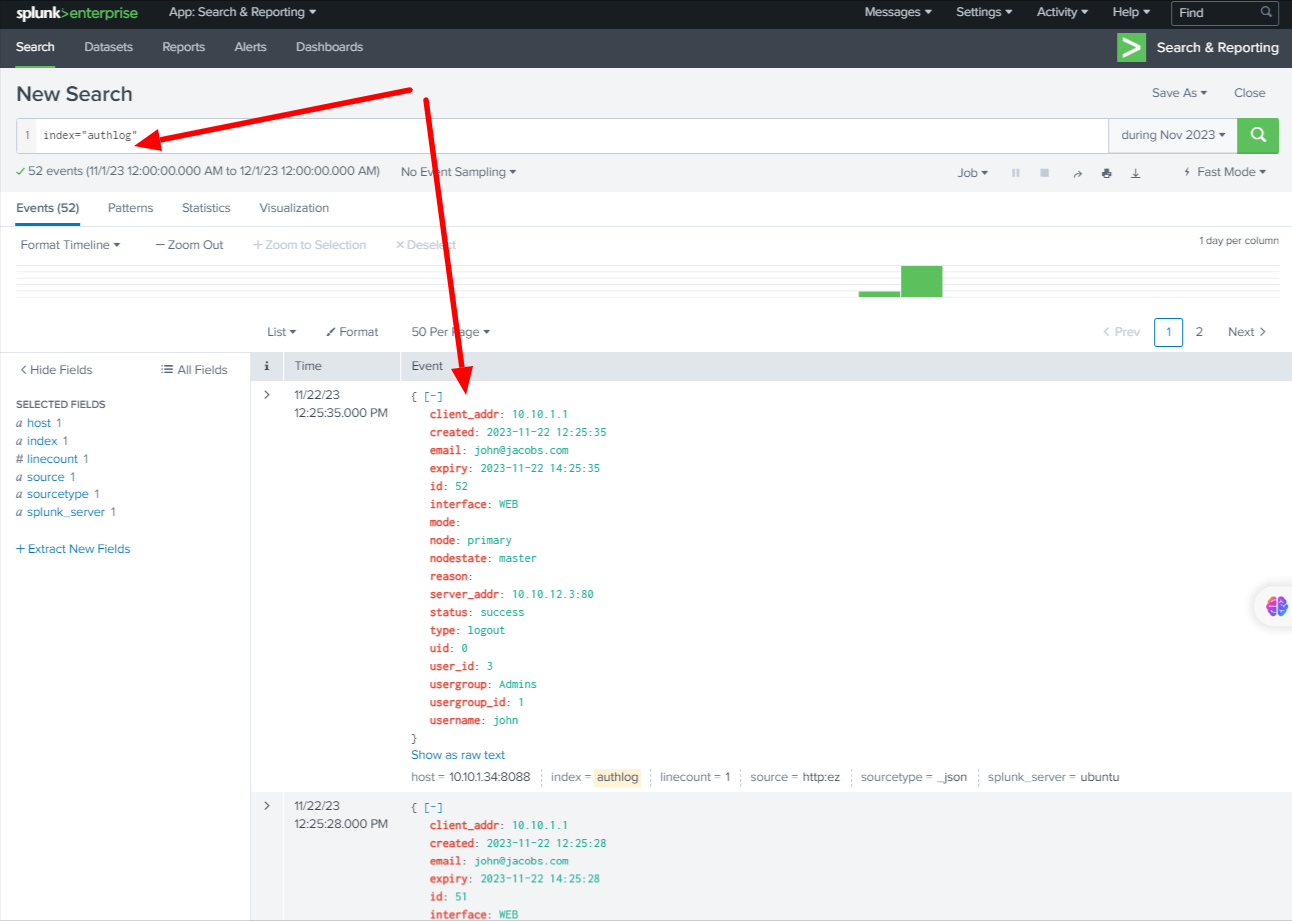
Now you can view the Ezeelogin logs on Splunk.
For example: Ezeelogin Authentication logs can be viewed by searching the index="authlog"
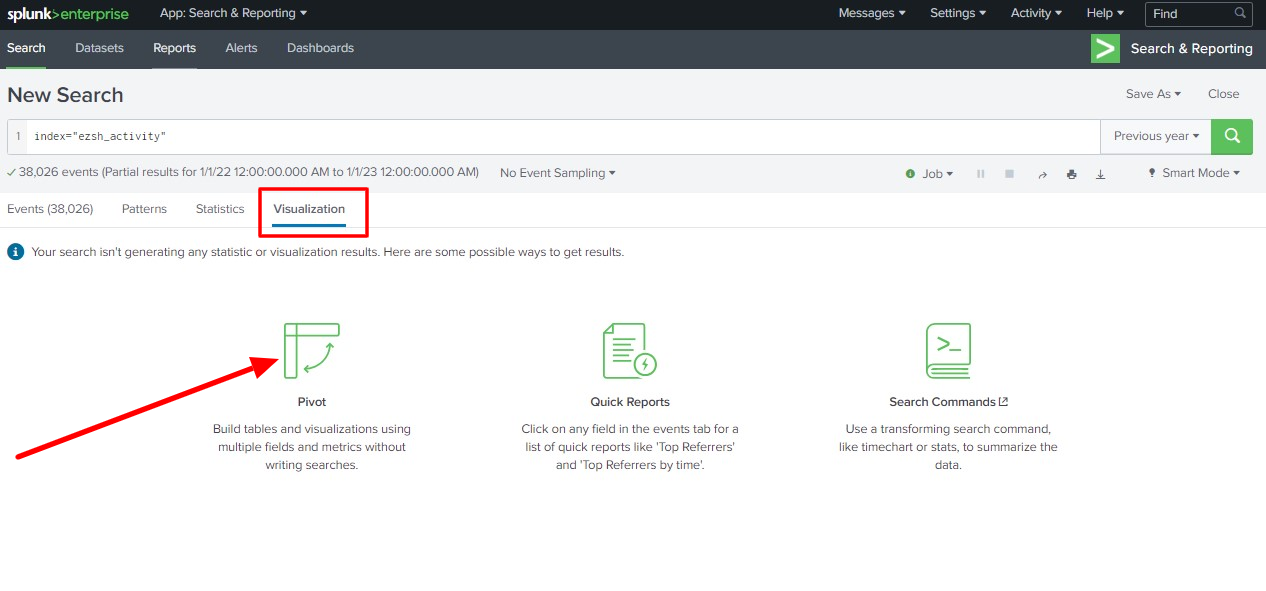
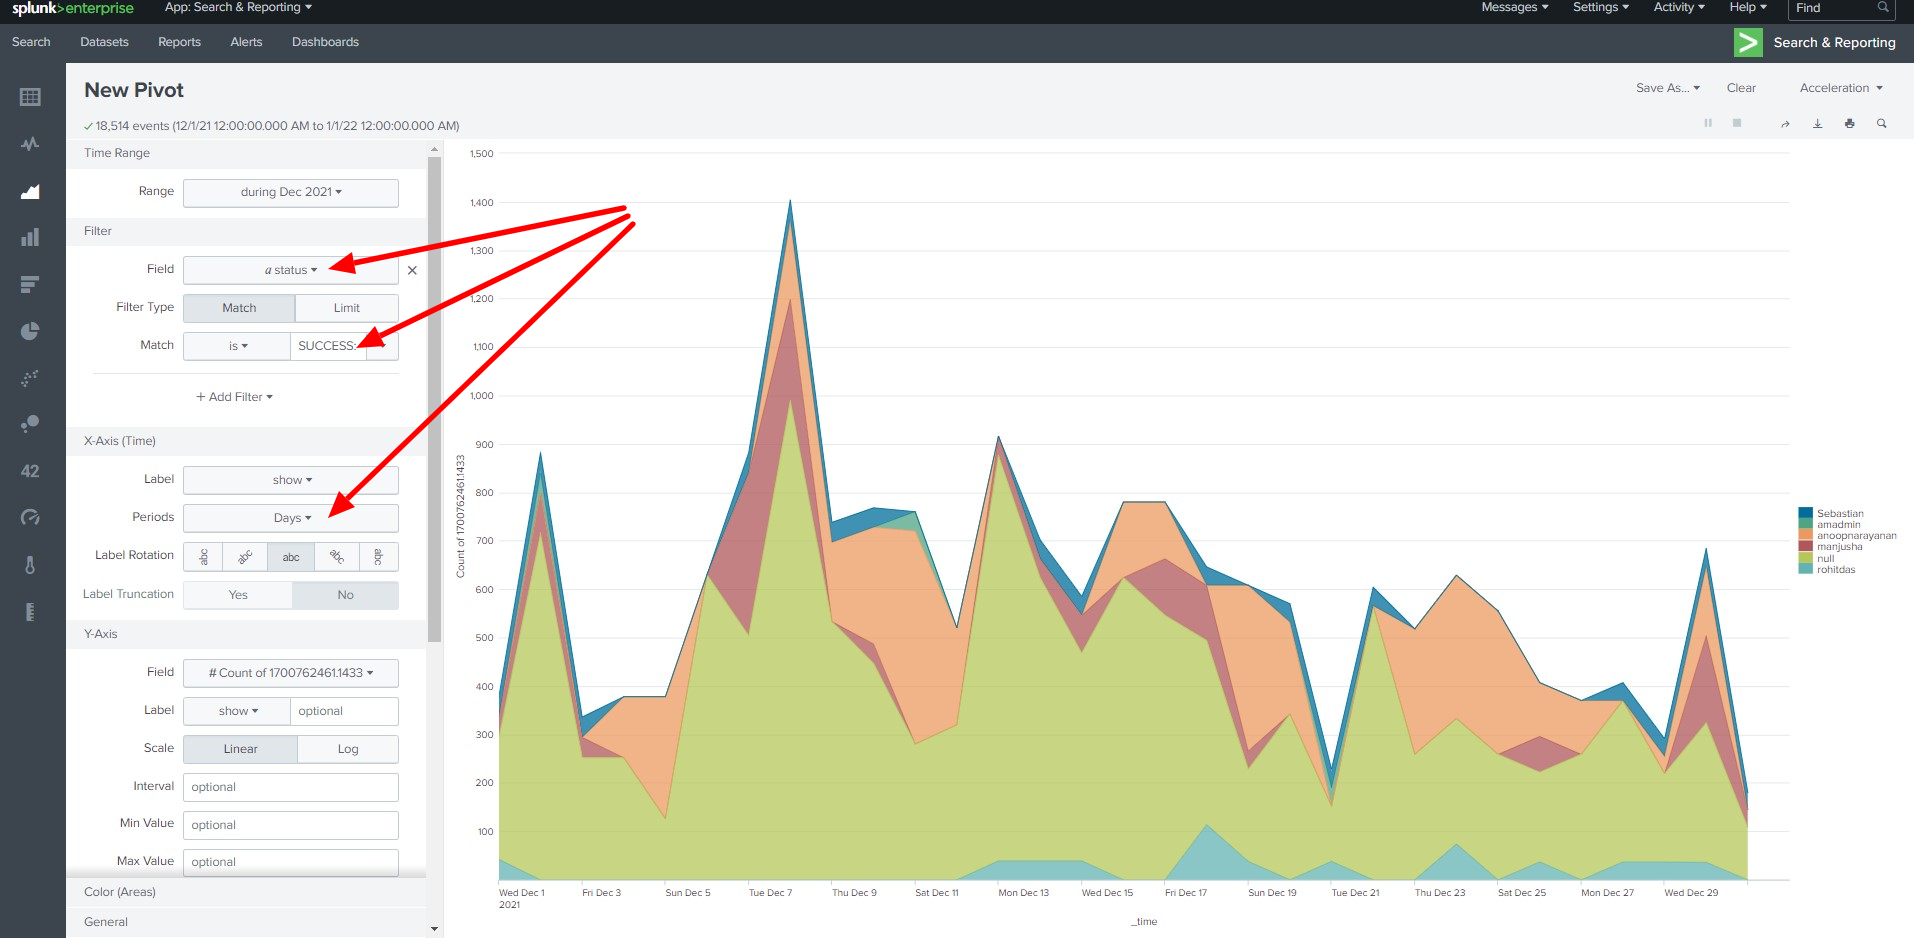
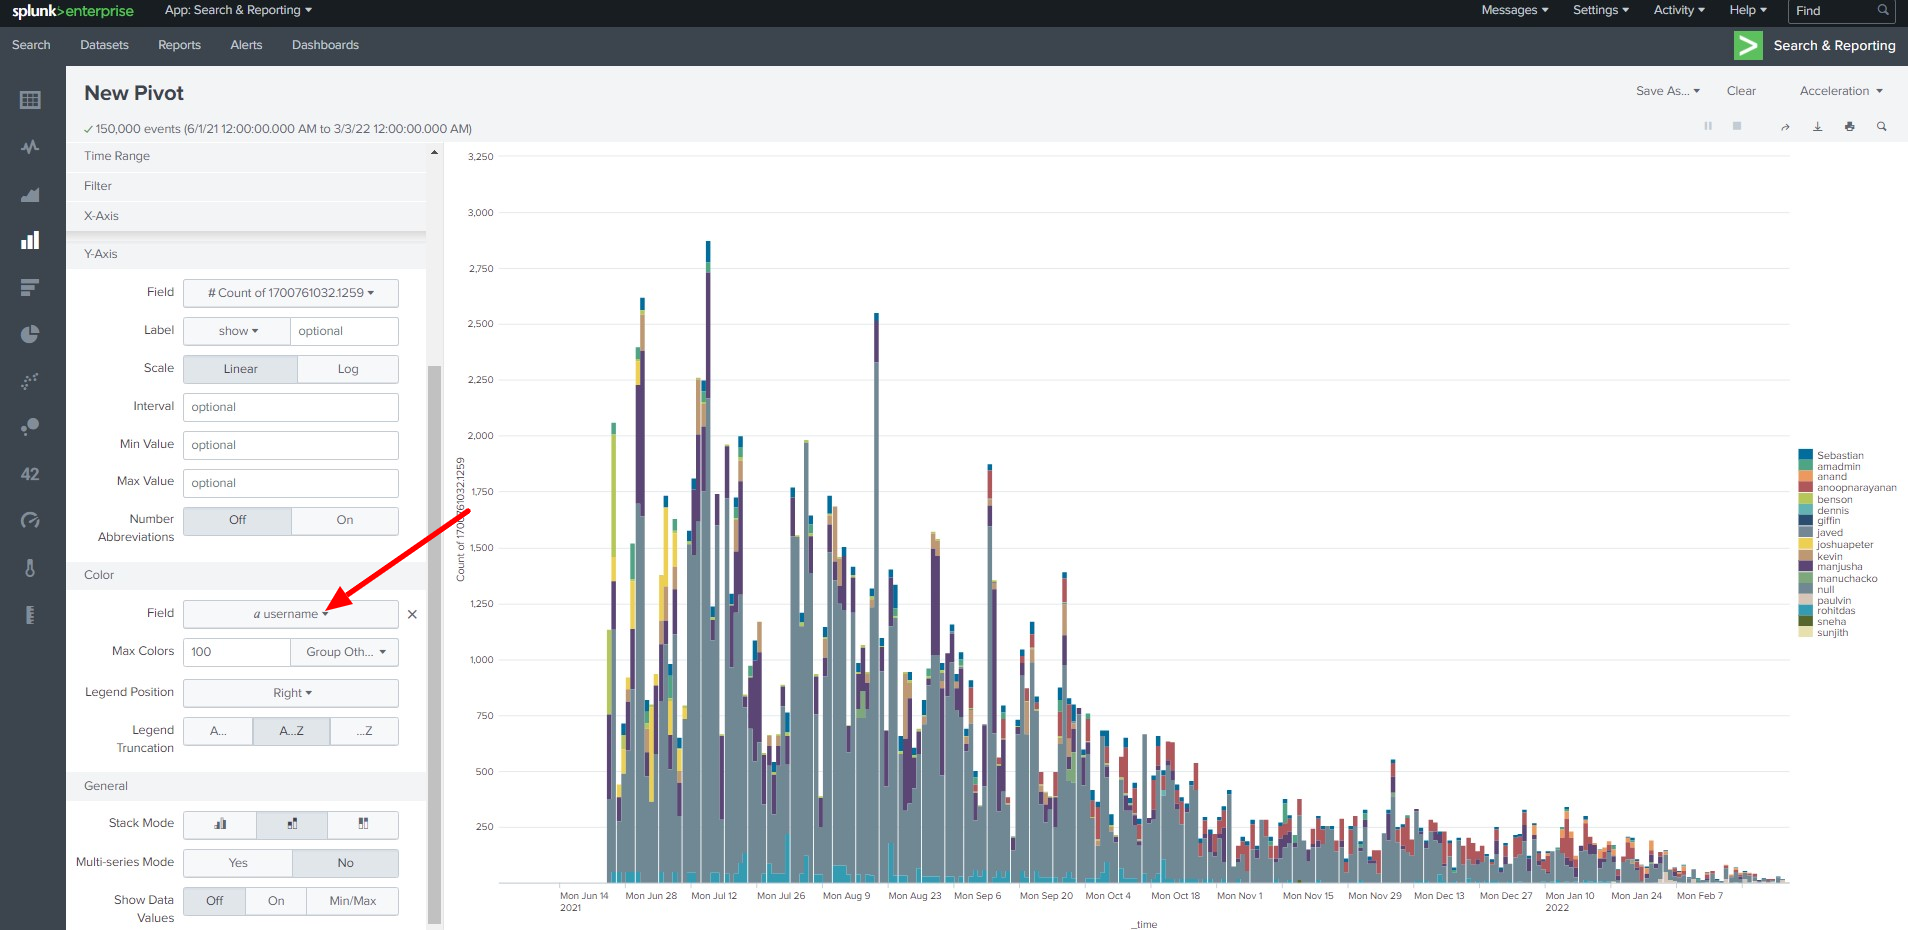
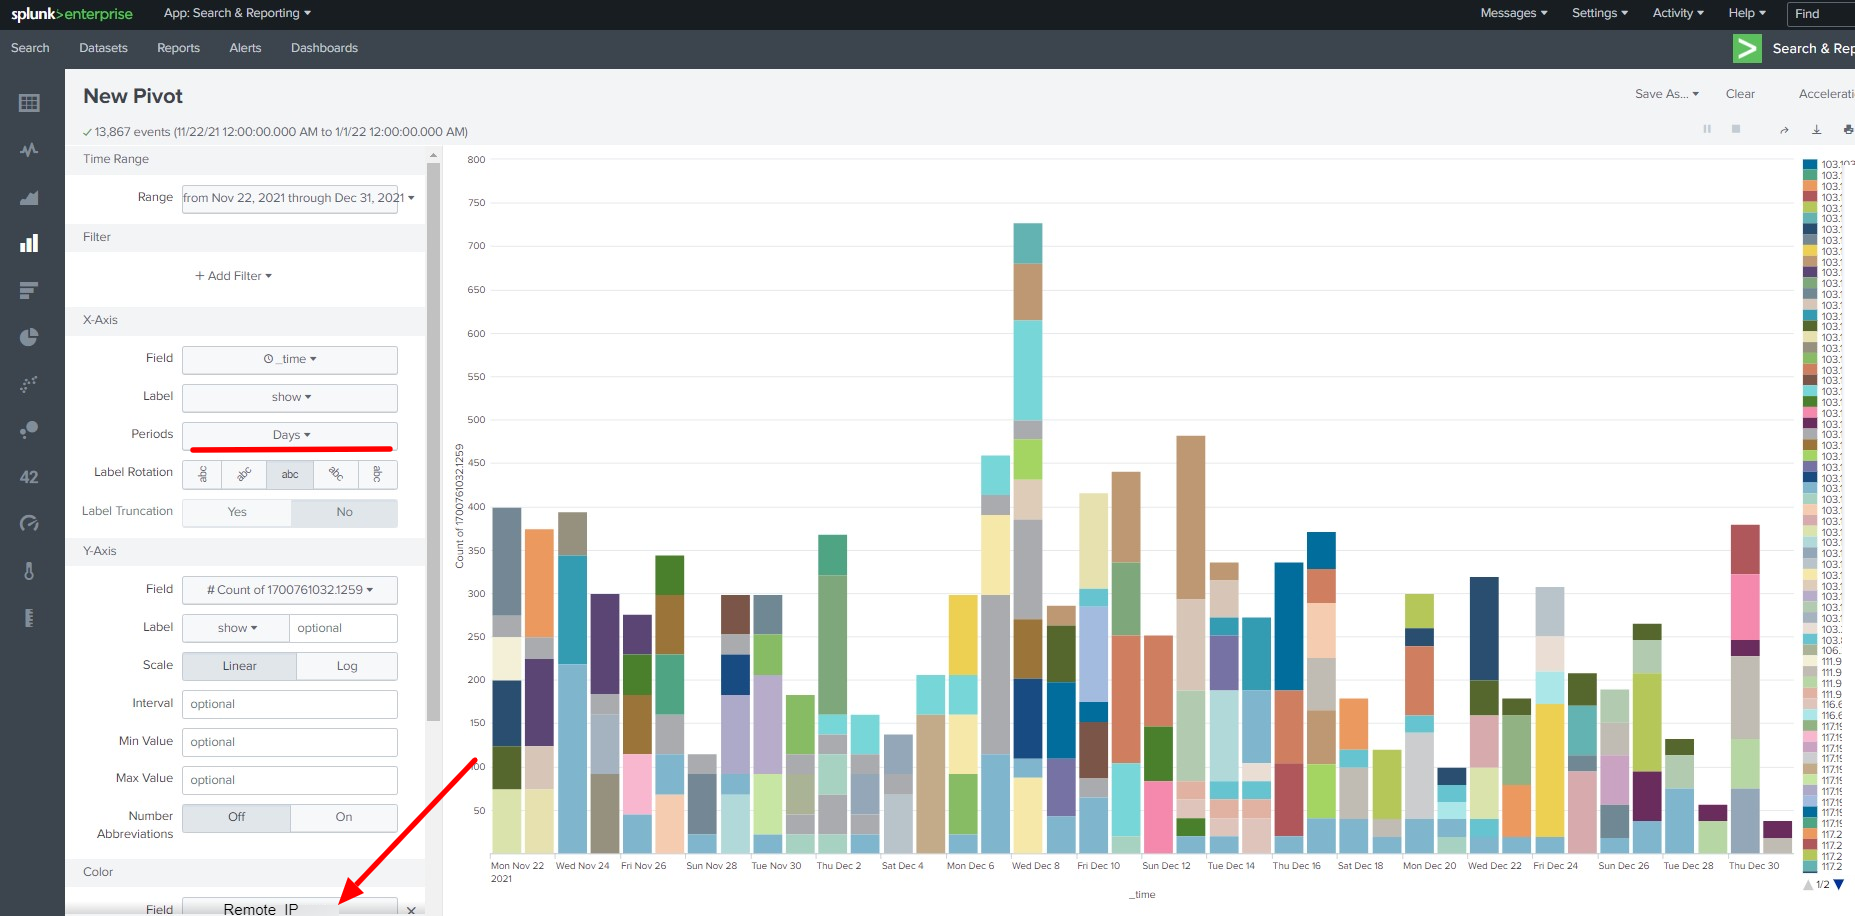
You can create visualizations from the data using the "Visualization" feature
Click on Visualization then click Pivot
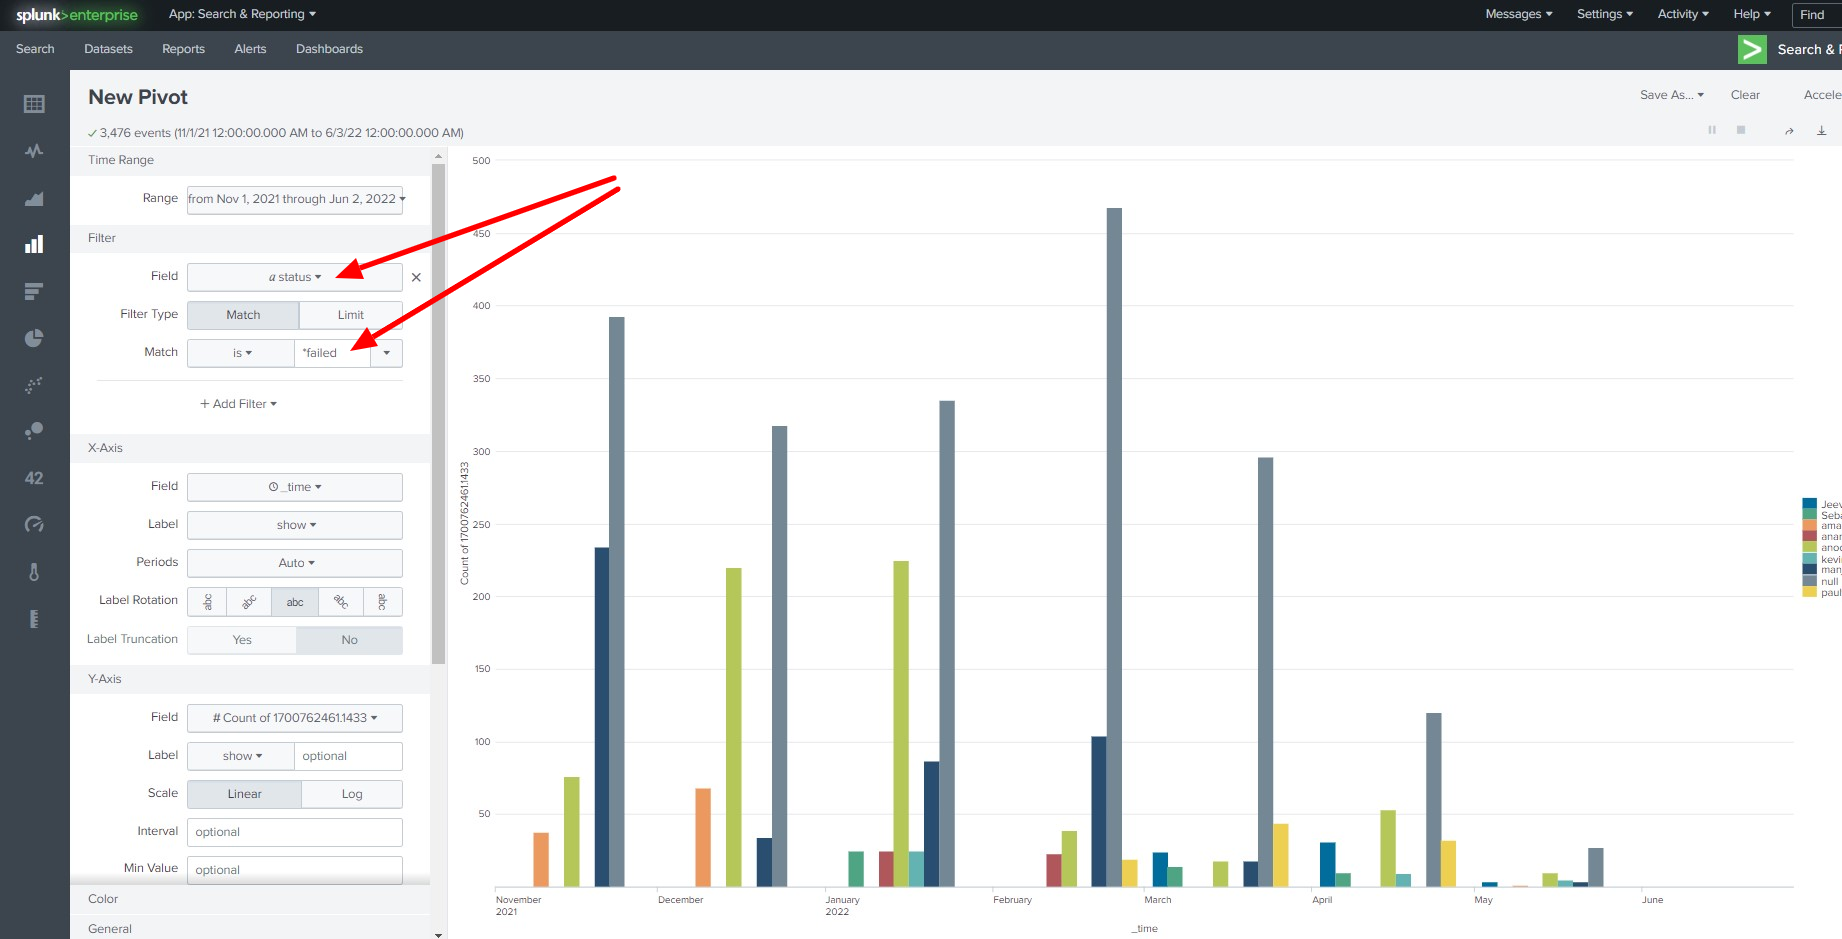
You can create different types of Visualizations from the data
- Top user access to Ezeelogin shell
Successful Login attempts to the Ezeelogin gateway per day
- Failed Login attempts to the Ezeelogin shell
- Top Daily access from IP address
Related Articles:
Integrate Ezeelogin SSH Jump host with syslog
Audit logs and configurations