Error log file and configuration file to troubleshoot
Ezeelogin Troubleshooting: Error Logs and Configuration Files
Overview: This article provides information about error log files for both backend operations and web interface(Webgui), along with instructions on monitoring console errors.

Location of configuration and log files for troubleshooting.
- The configuration file is located at /usr/local/etc/ezlogin/ez.conf
- Ezeelogin has two log files one for the web interface and one for the backend ssh interface.
1. FRONTEND OR WEB INTERFACE LOGS { Application log }
- The front end or web interface runs on PHP; hence, we have a separate log file for it. The log files are stored in the /{system folder specified at the installation time.
- If you experience any issues on the web interface or GUI, refer to this log file for details.
Run the following command to navigate to the log directory:
root@gateway:~# cd $(awk '/^system_folder/ {print $2}' /usr/local/etc/ezlogin/ez.conf)/application/logs/
or
root@gateway:~# ( cd $(awk '/^system_folder/ {print $2}' /usr/local/etc/ezlogin/ez.conf)/application/logs/ && tail -f $(ls -t log-*.php | head -n 1) )
- You can find the same path by checking the system_folder in /usr/local/etc/ezlogin/ez.conf. The path would be /{system folder}/application/logs/. After changing to that directory, you can check the latest log. Refer to the below screenshot.

2. BACKEND OR SSH LOGS
- The backend or SSH error logs for each Ezeelogin user are stored in the /home/{username}/ezsh.log file. Replace {username} with the user who is facing the issue.
- If you are having any issues with the SSH logins, this is the log file to look at.

For a detailed debug log for troubleshooting, do append the parameter log_level trace in ez.conf
3. How to check errors from the browser console?
- Open the web page where you encountered errors.
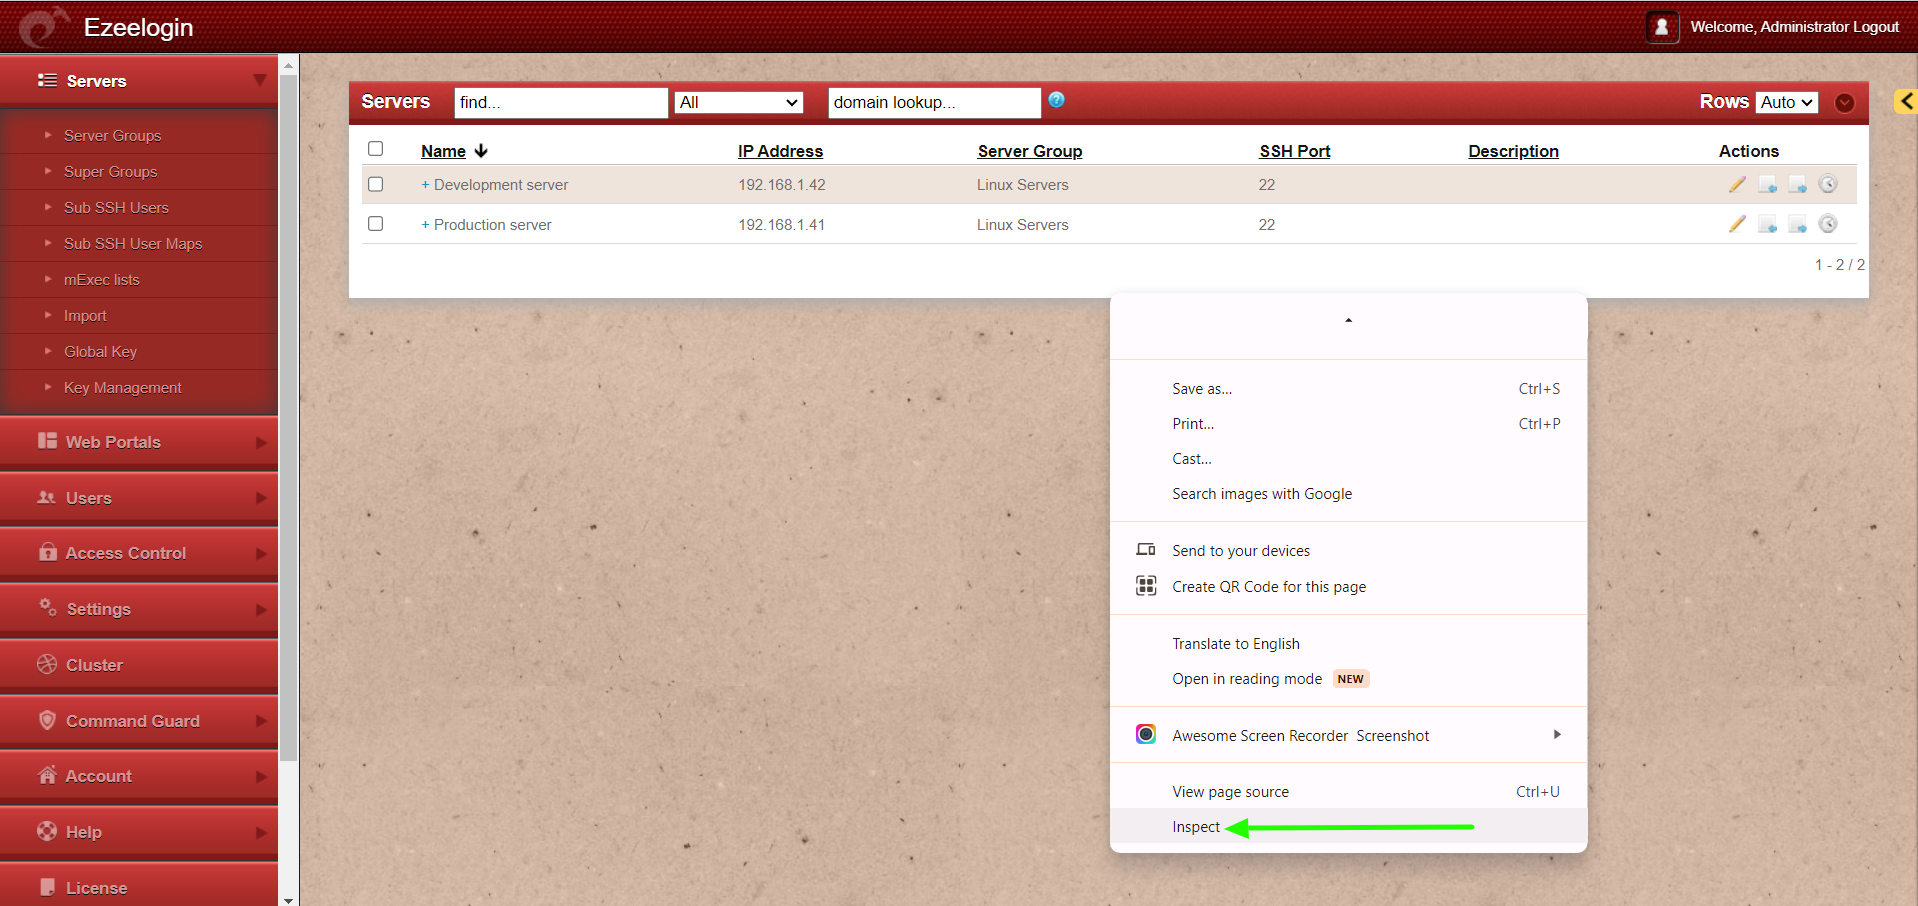
- Right-click on the page and select "Inspect" from the menu. This will open the Chrome DevTools.

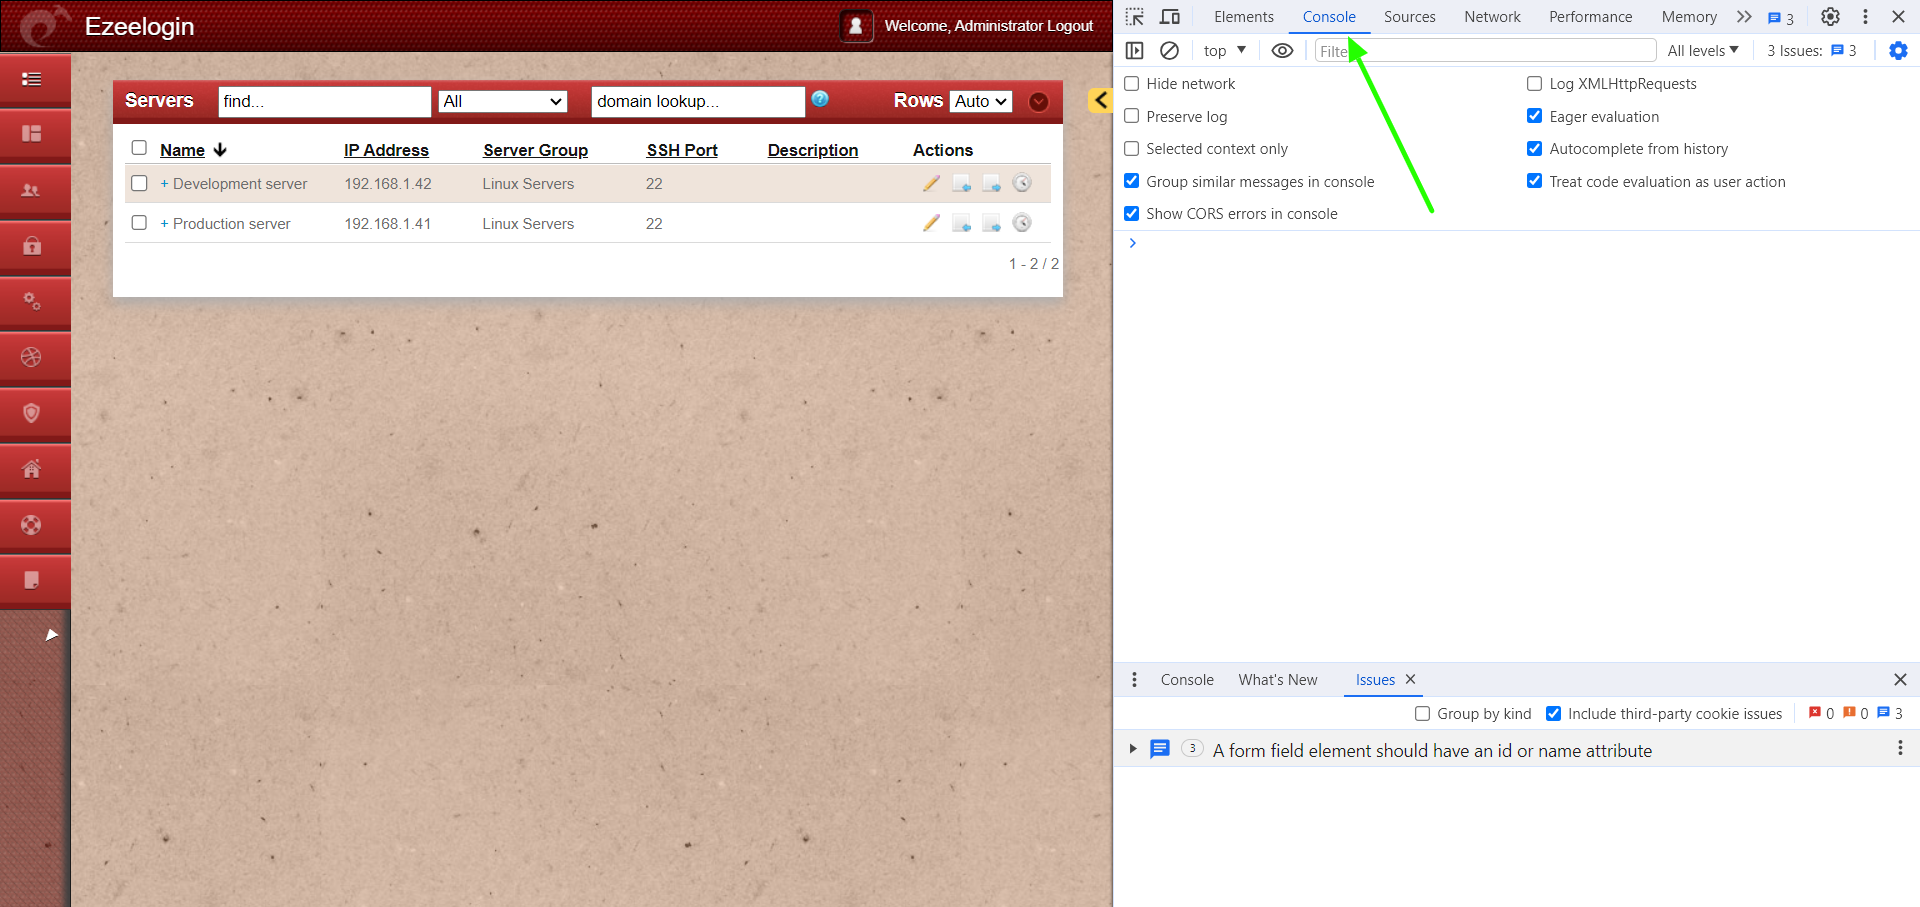
- In the DevTools window, navigate to the "Console" tab.

- Any errors, warnings, or logs will be displayed in the console.
4. Web proxy logs
Run the below command to get the web portal start command from the latest log file, and then append DEBUG=* at the beginning of the command you get:
root@gateway:~# ( cd $(awk '/^system_folder/ {print $2}' /usr/local/etc/ezlogin/ez.conf)/application/logs/ && less $(ls -t log-*.php | head -n 1) ) | grep -i 'Web Proxy node: PORT'
DEBUG - 2025-05-27 10:19:43 --> start Web Proxy node: PORT=52666 XFWD=1 WS=1 SESSION_TIMEOUT=300000 REQUEST_TIMEOUT=120000 DBP='s}T@2Wrbu(33Ab@@*6Z.m9D@!7' PUPPETEER_CACHE_DIR=/usr/local/ezlogin /usr/local/bin/node /var/www/ezlogin/application/external/ezproxy/index.js >/dev/null 2>&1 &, 0, Array
For example:
root@gateway:~# DEBUG=* PORT=52666 XFWD=1 WS=1 SESSION_TIMEOUT=300000 REQUEST_TIMEOUT=120000 DBP='s}T@2Wrbu(33Ab@@*6Z.m9D@!7' PUPPETEER_CACHE_DIR=/usr/local/ezlogin /usr/local/bin/node /var/www/ezlogin/application/external/ezproxy/index.js
5. RDP logs
Run the below command to get the web RDP start command from the latest log file, and then append DEBUG=* at the beginning of the command you get:
root@gateway:~# ( cd $(awk '/^system_folder/ {print $2}' /usr/local/etc/ezlogin/ez.conf)/application/logs/ && less $(ls -t log-*.php | head -n 1) ) | grep -i 'RDP node: PORT'
DEBUG - 2025-05-27 14:40:47 --> start RDP node: PORT=22555 DBP='s}T@2Wrbu(33Ab@@*6Z.m9D@!7' /usr/local/bin/node /var/www/ezlogin/application/external/mstsc/server.js >/dev/null 2>&1 &, 0, Array
For example:
root@gateway:~# DEBUG=* PORT=22555 DBP='s}T@2Wrbu(33Ab@@*6Z.m9D@!7' /usr/local/bin/node /var/www/ezlogin/application/external/mstsc/server.js
"log_level trace parameter will only work from Ezeelogin version 7.23.0".
Contact our support department if you face any further difficulties.
Related Articles:
How do I get detailed logs from Ezeelogin error logs?